Recently I connected an NVIDIA RTX4500 Blackwell Server Edition Datacenter GPU on the Minisforum MS-A2 mini computer (aka homelab server) running VMware vSphere and NVIDIA vGPU.
As a proof of concept, I wanted to share how I did this, what parts I used, and share my success running NVIDIA vGPU.
This PoC can be used to run VDI workloads (example Omnissa Horizon), and/or AI models.
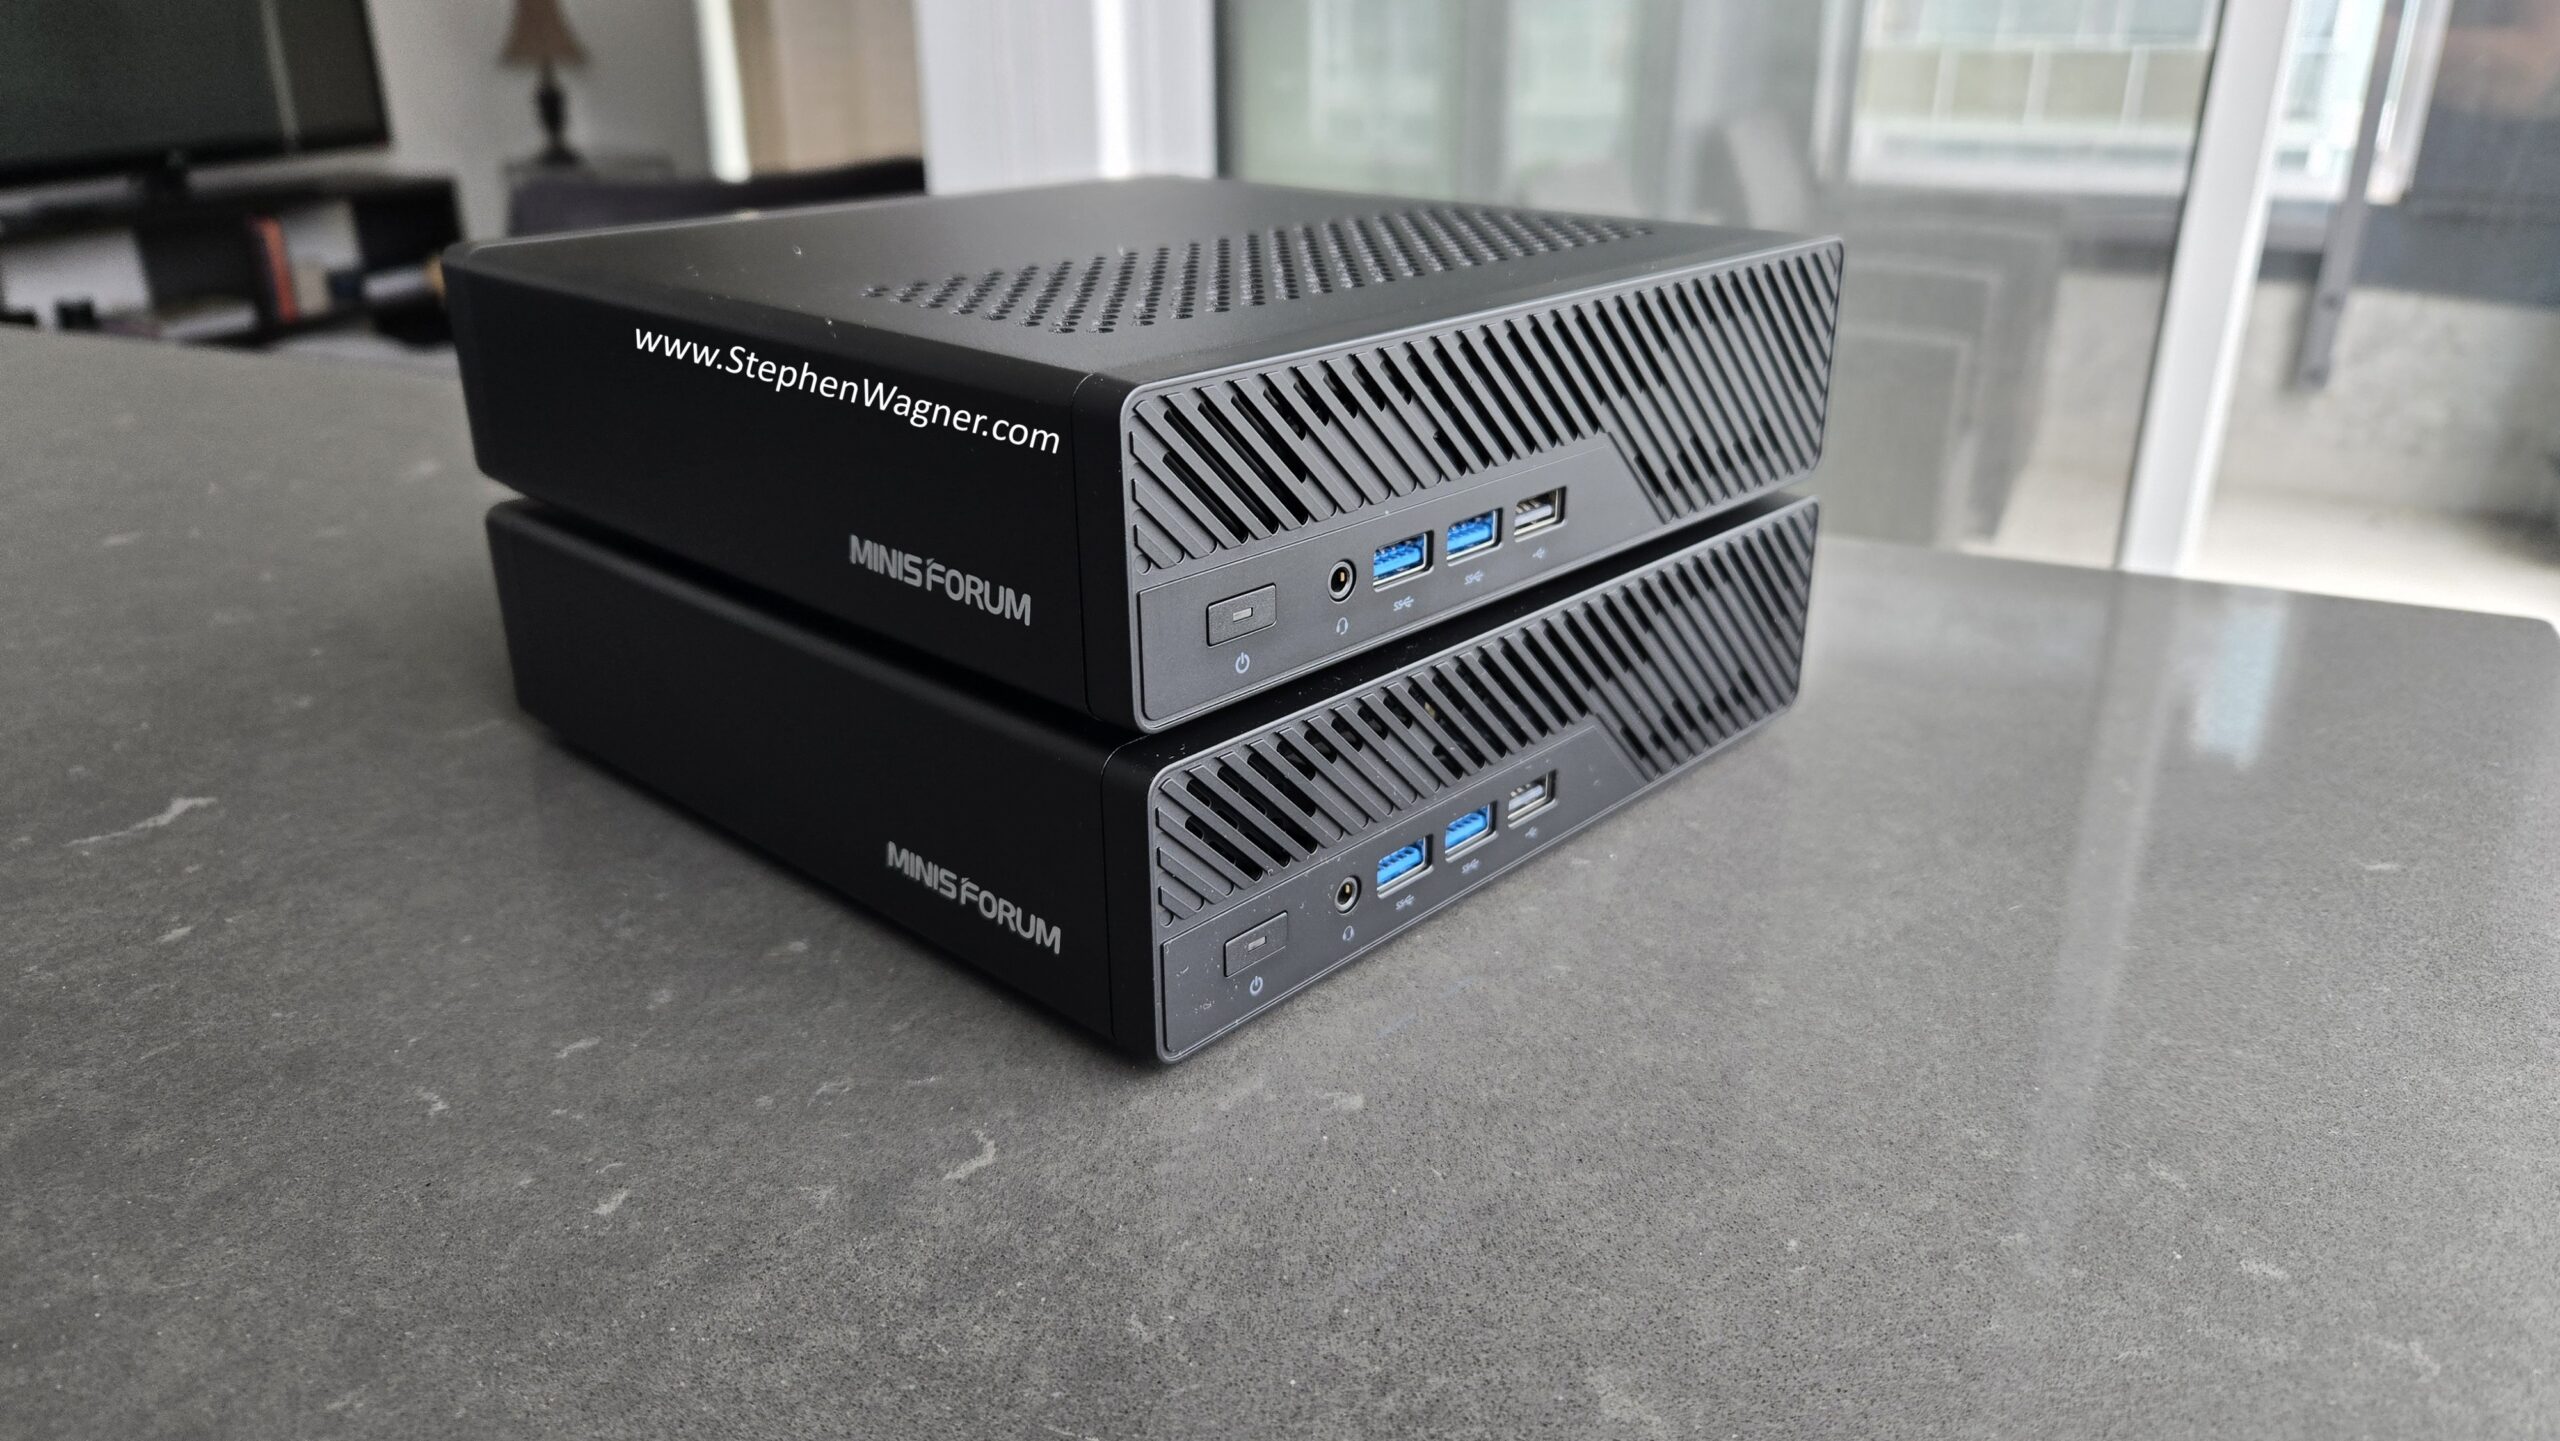
Minisforum MS-A2
As an introduction, the Minisforum MS-A2 is a mini-computer that packs a punch. The ones I purchased have the following specs:
- AMD Ryzen 9 9955HX Processor
- 128GB of RAM
- M.2/U.2 NVME Support (plenty of M.2 slots)
- Dual 10Gbps SFP+ NIC (supports VMware vSphere)
- Built-in PCIe x16 slot that supports bifurcation
- Numerous other goodies that I’m not listing
These have performed well in my homelab, and run VMware vSphere reliably.
Note that my preference for the MS-A2 systems is because they are running the AMD processor which handles VMware ESX without modification or disablement of cores which is required on some Intel newer generation systems.
Installing VMware ESX was simple.
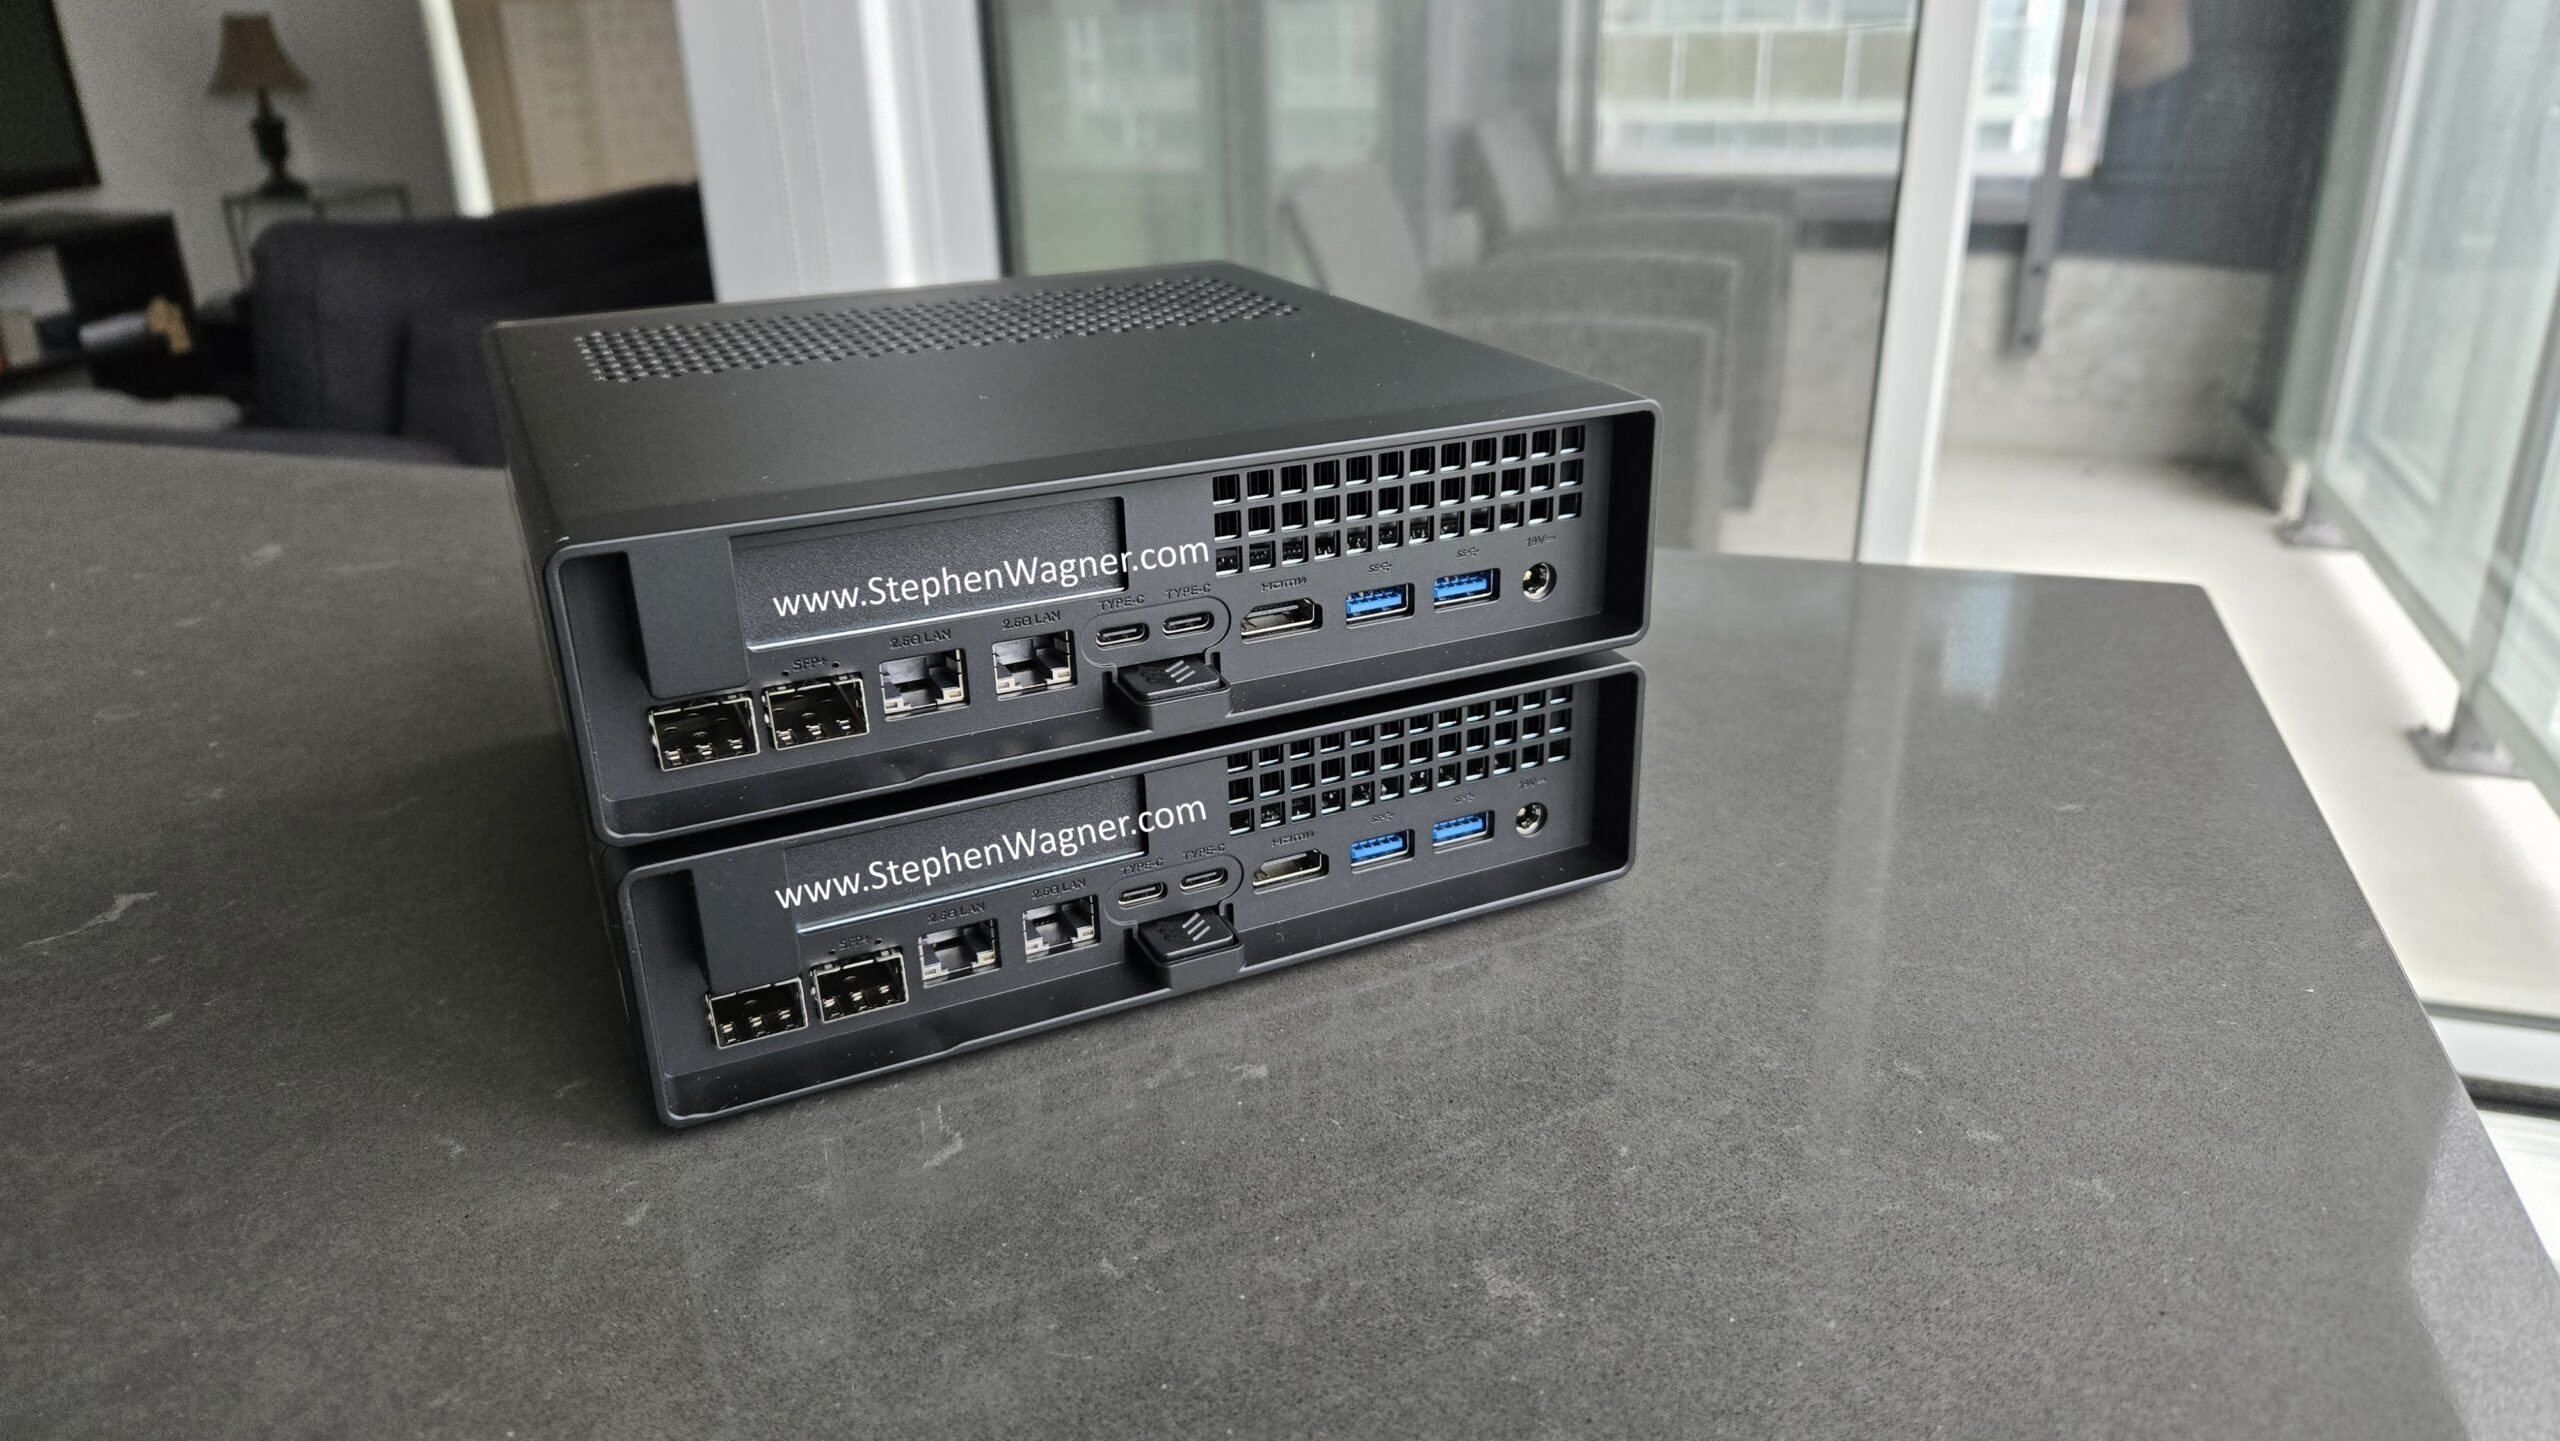
In my systems, I installed a dual OCuLink PCIe adapter, and enabled bifurcation in the BIOS. This allows us to connect the MS-A2 to external devices using an OCuLink cable.
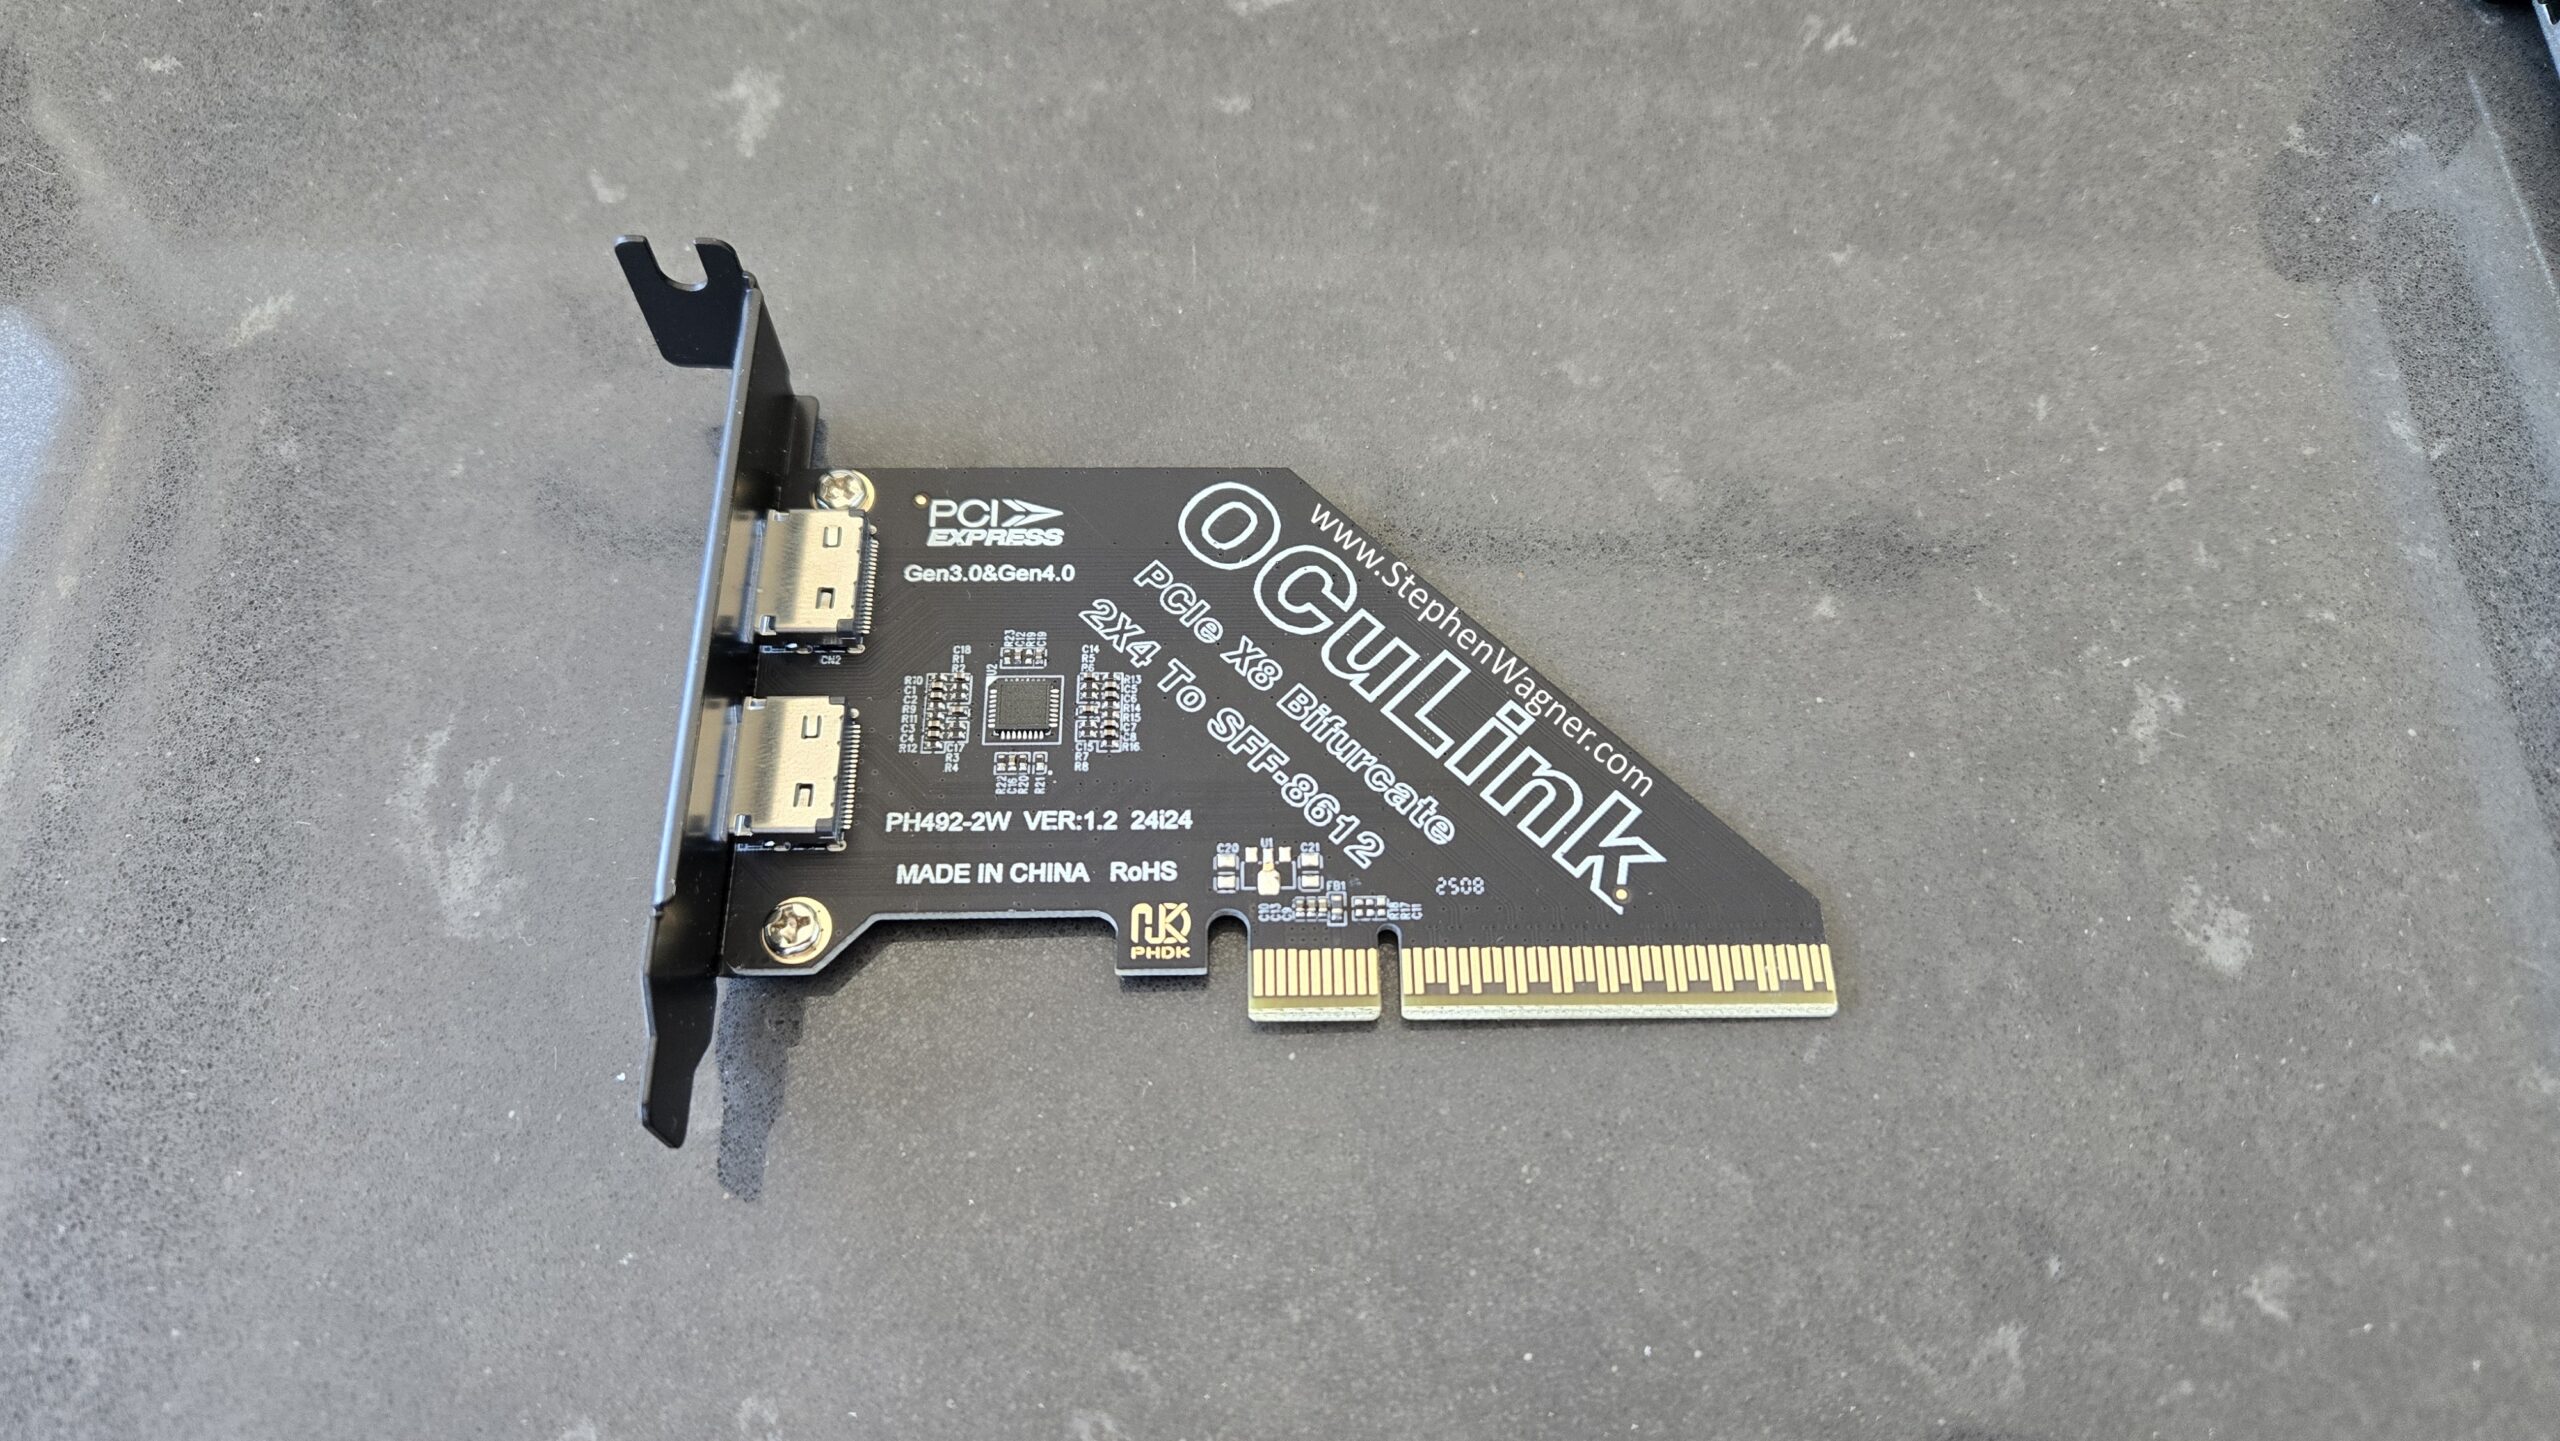
The card installs nicely, see below for images of the card installed internally, and ports on the rear of the Minisforum MS-A2.
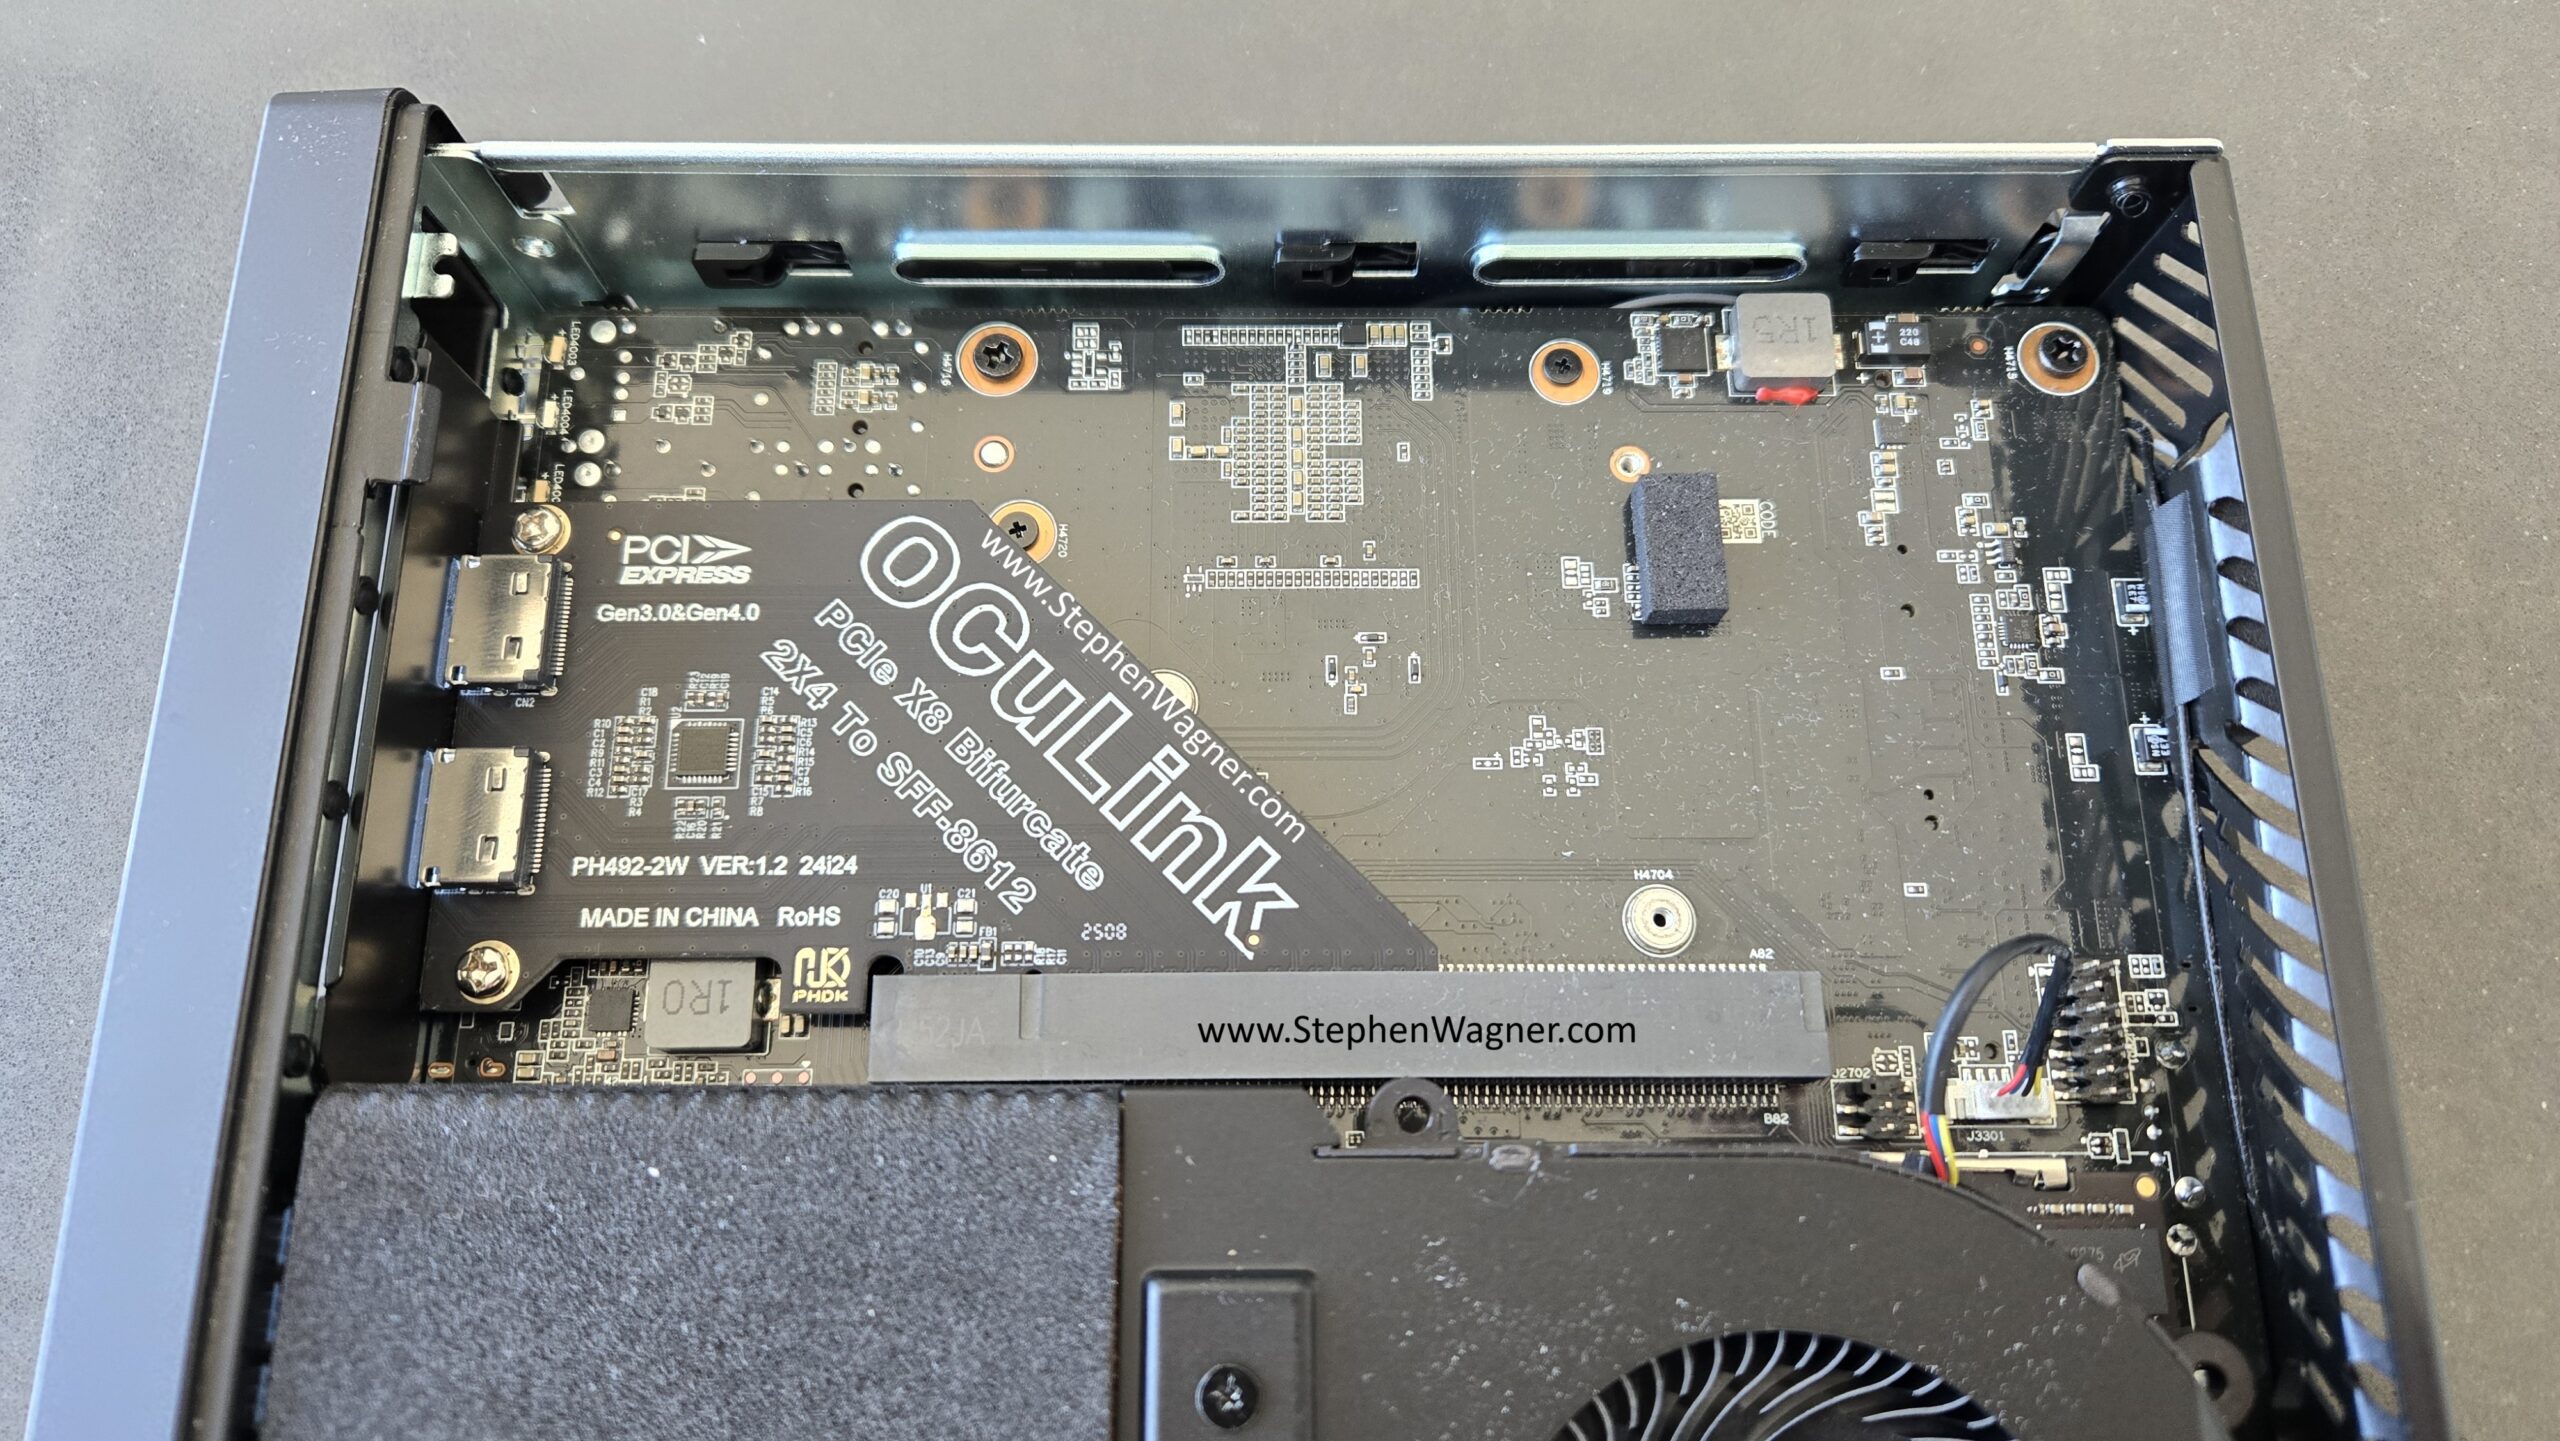
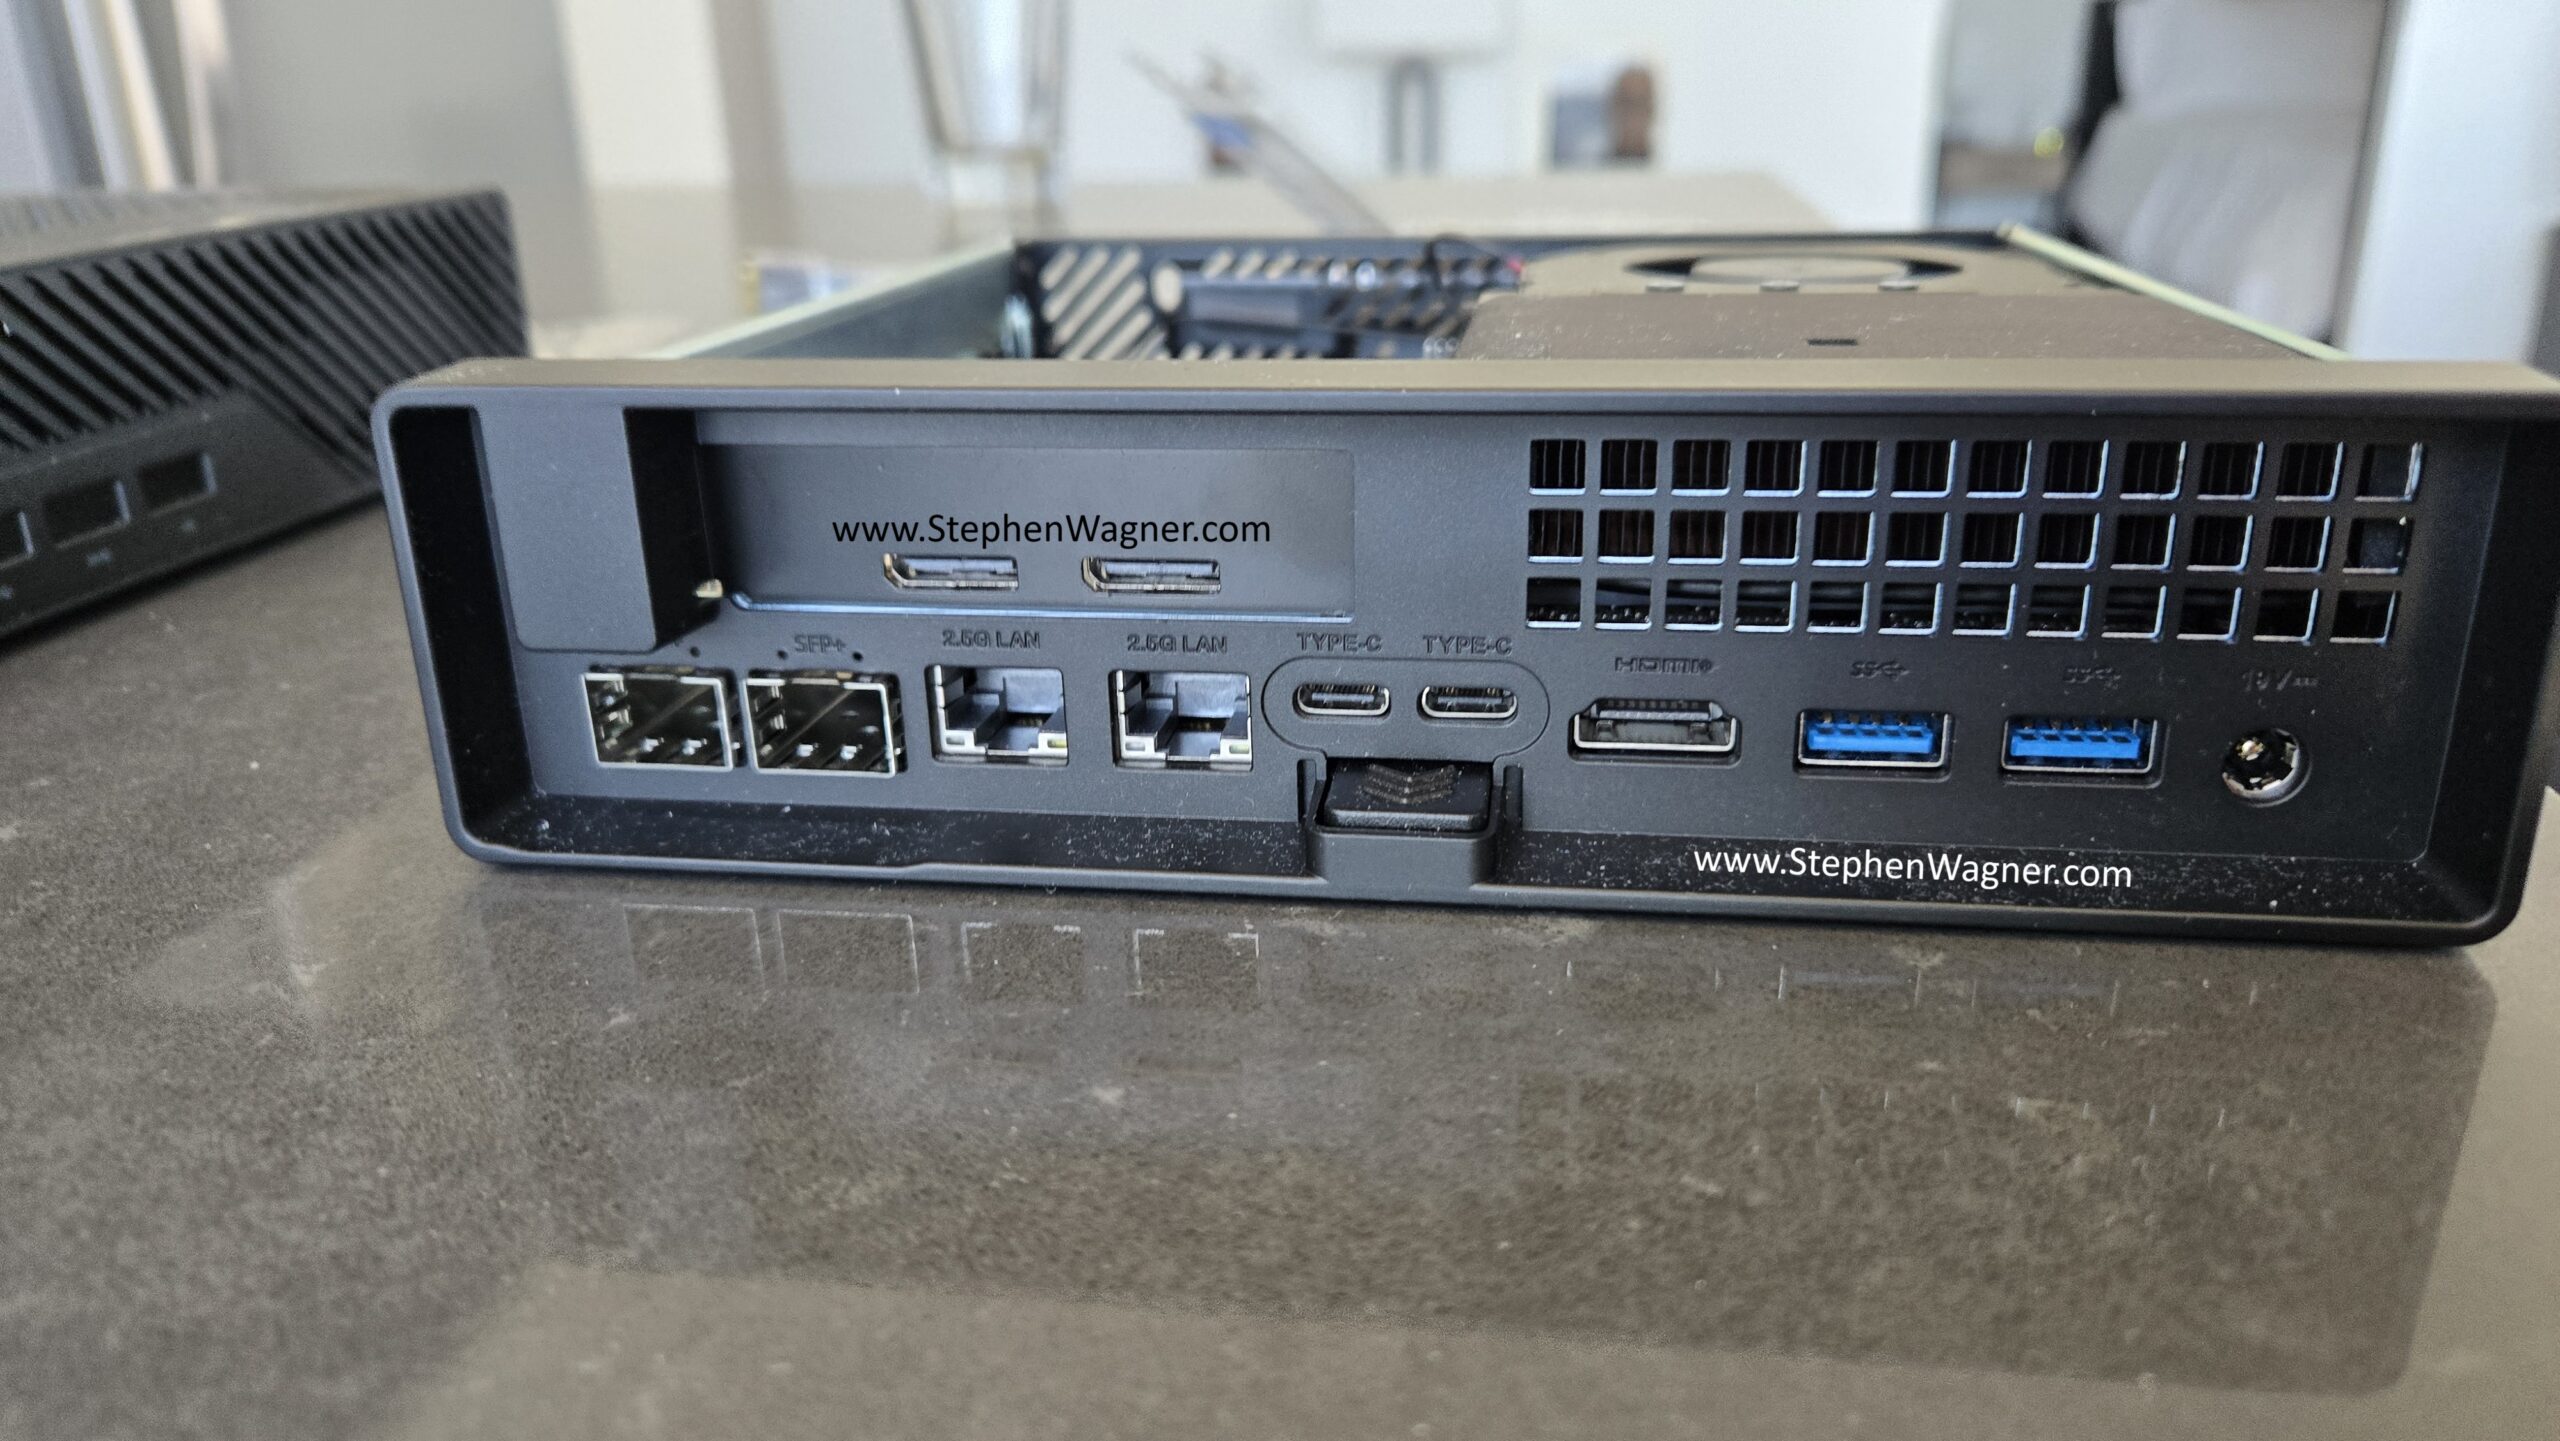
As you can see, it’s a nice clean install.
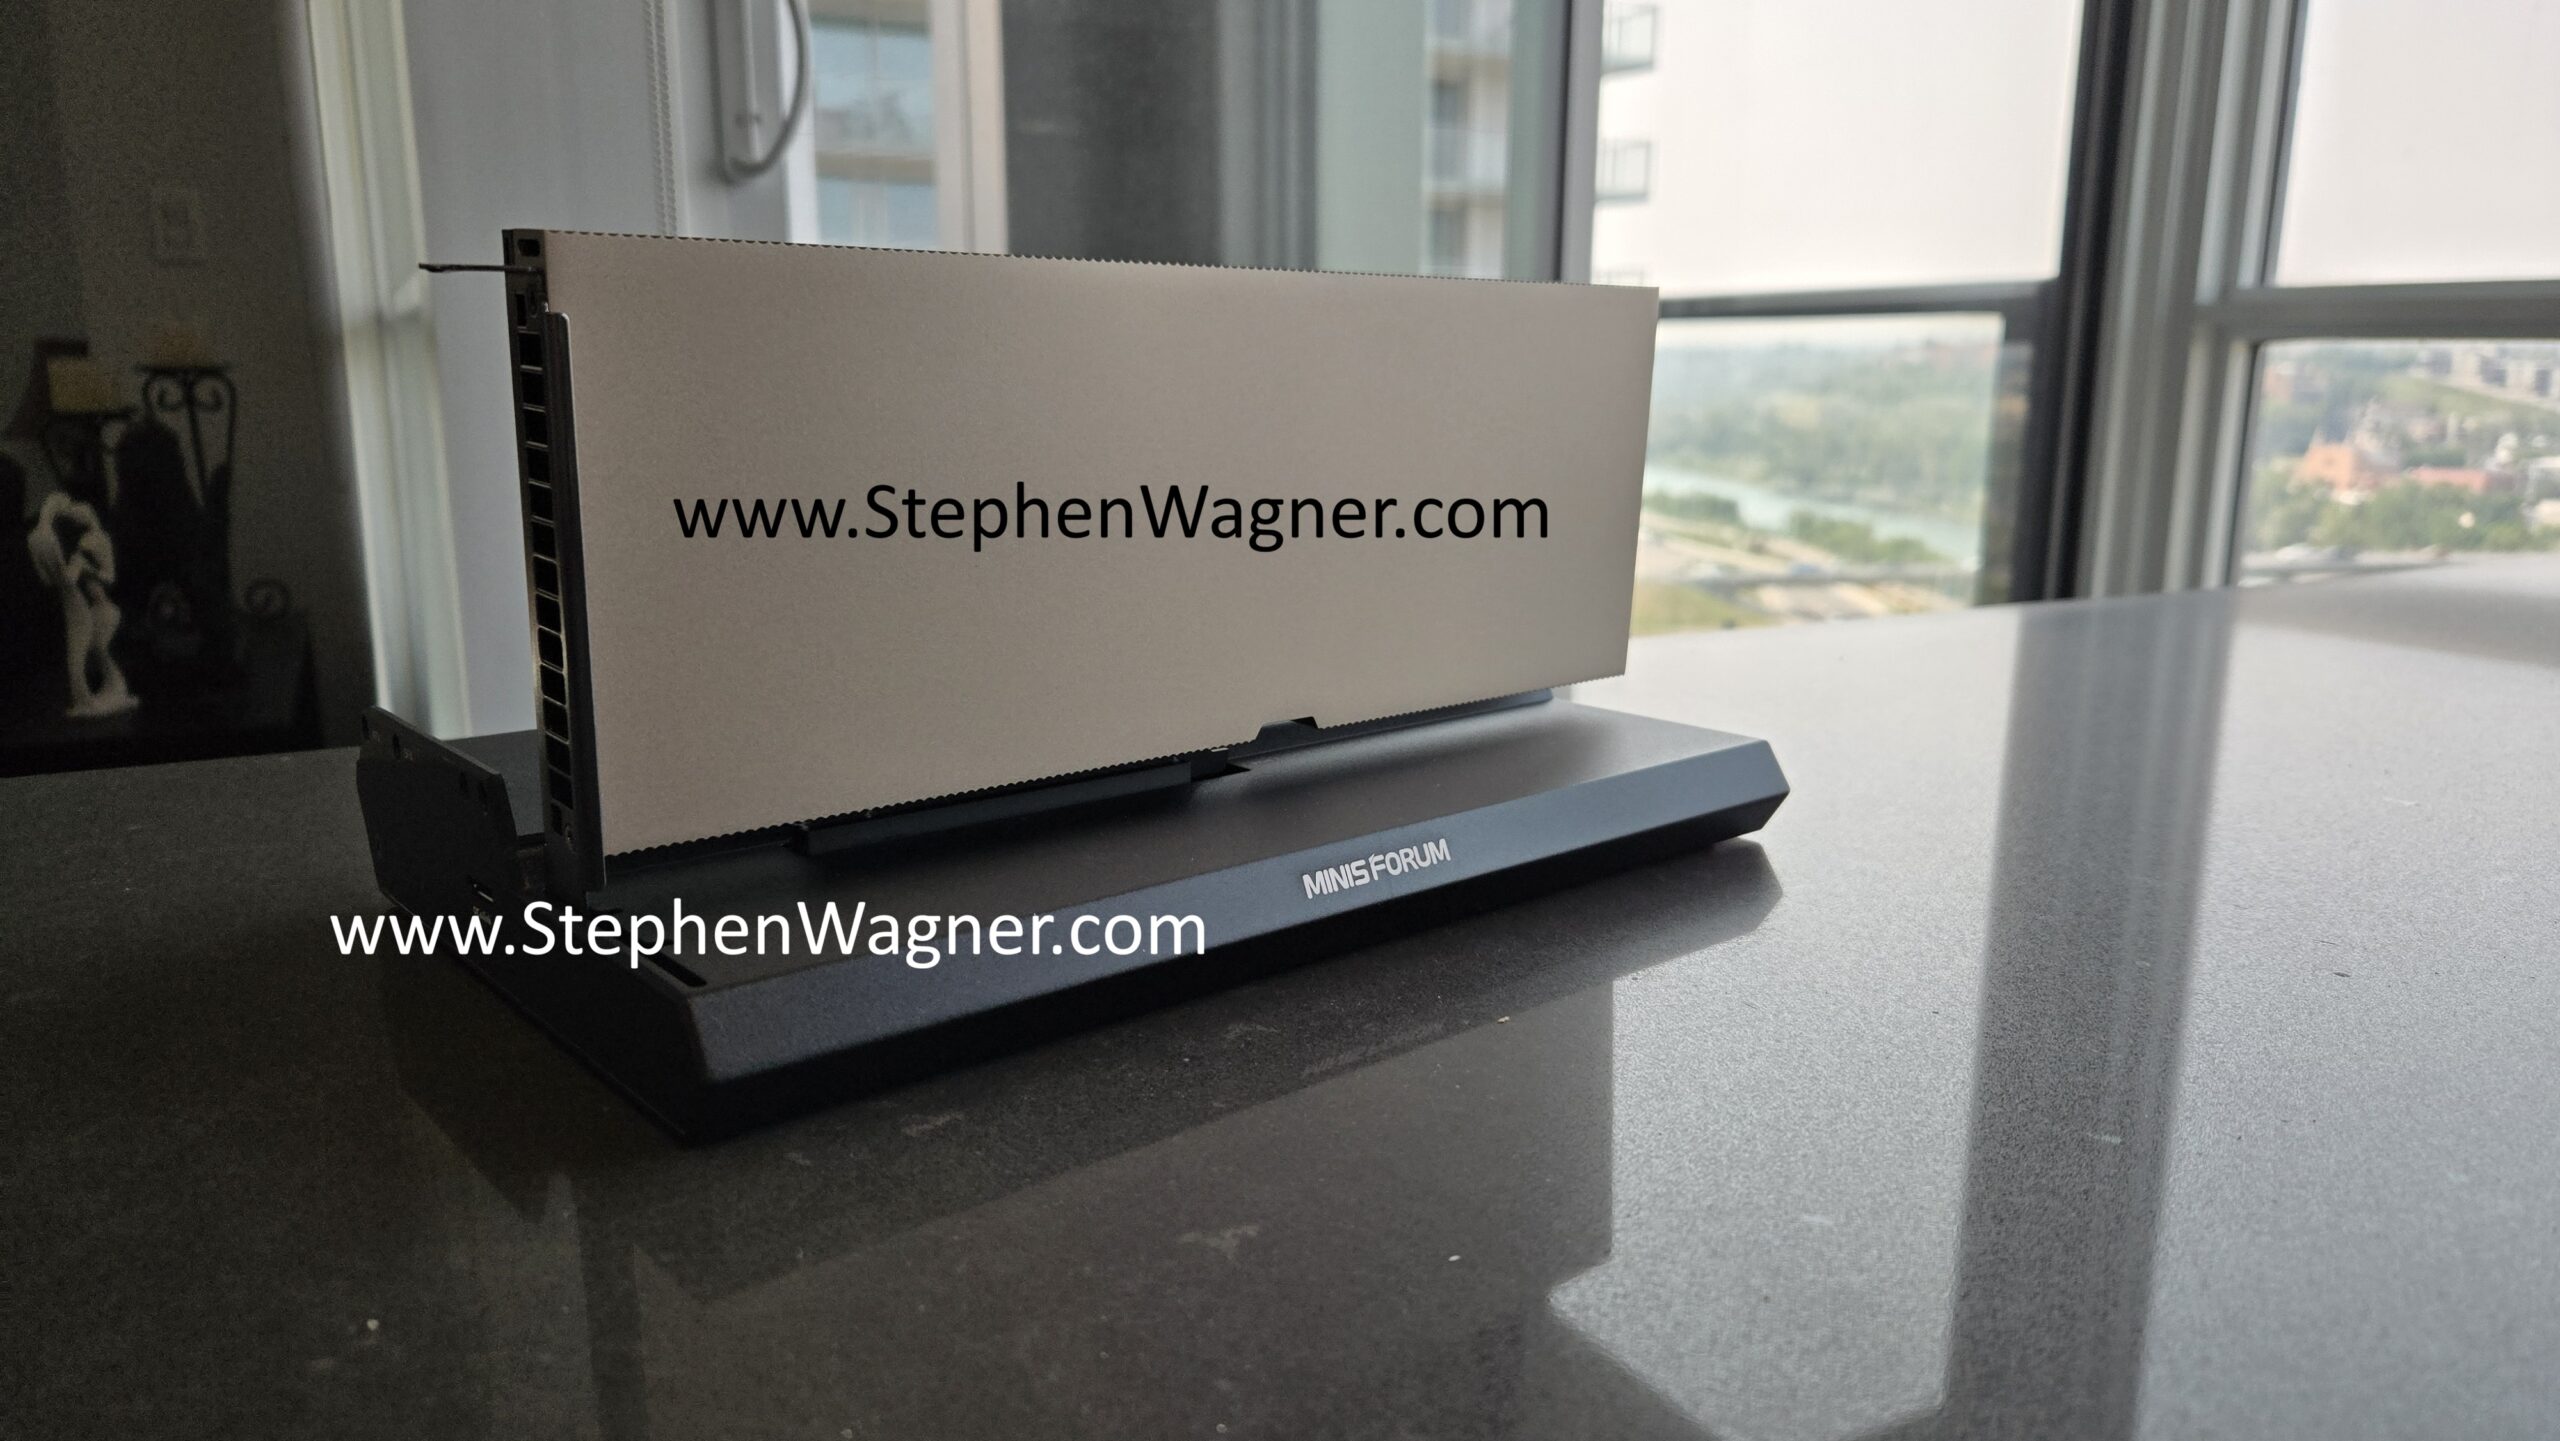
Minisforum DEG1 OCuLink eGPU Dock
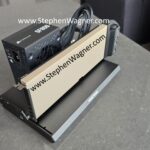
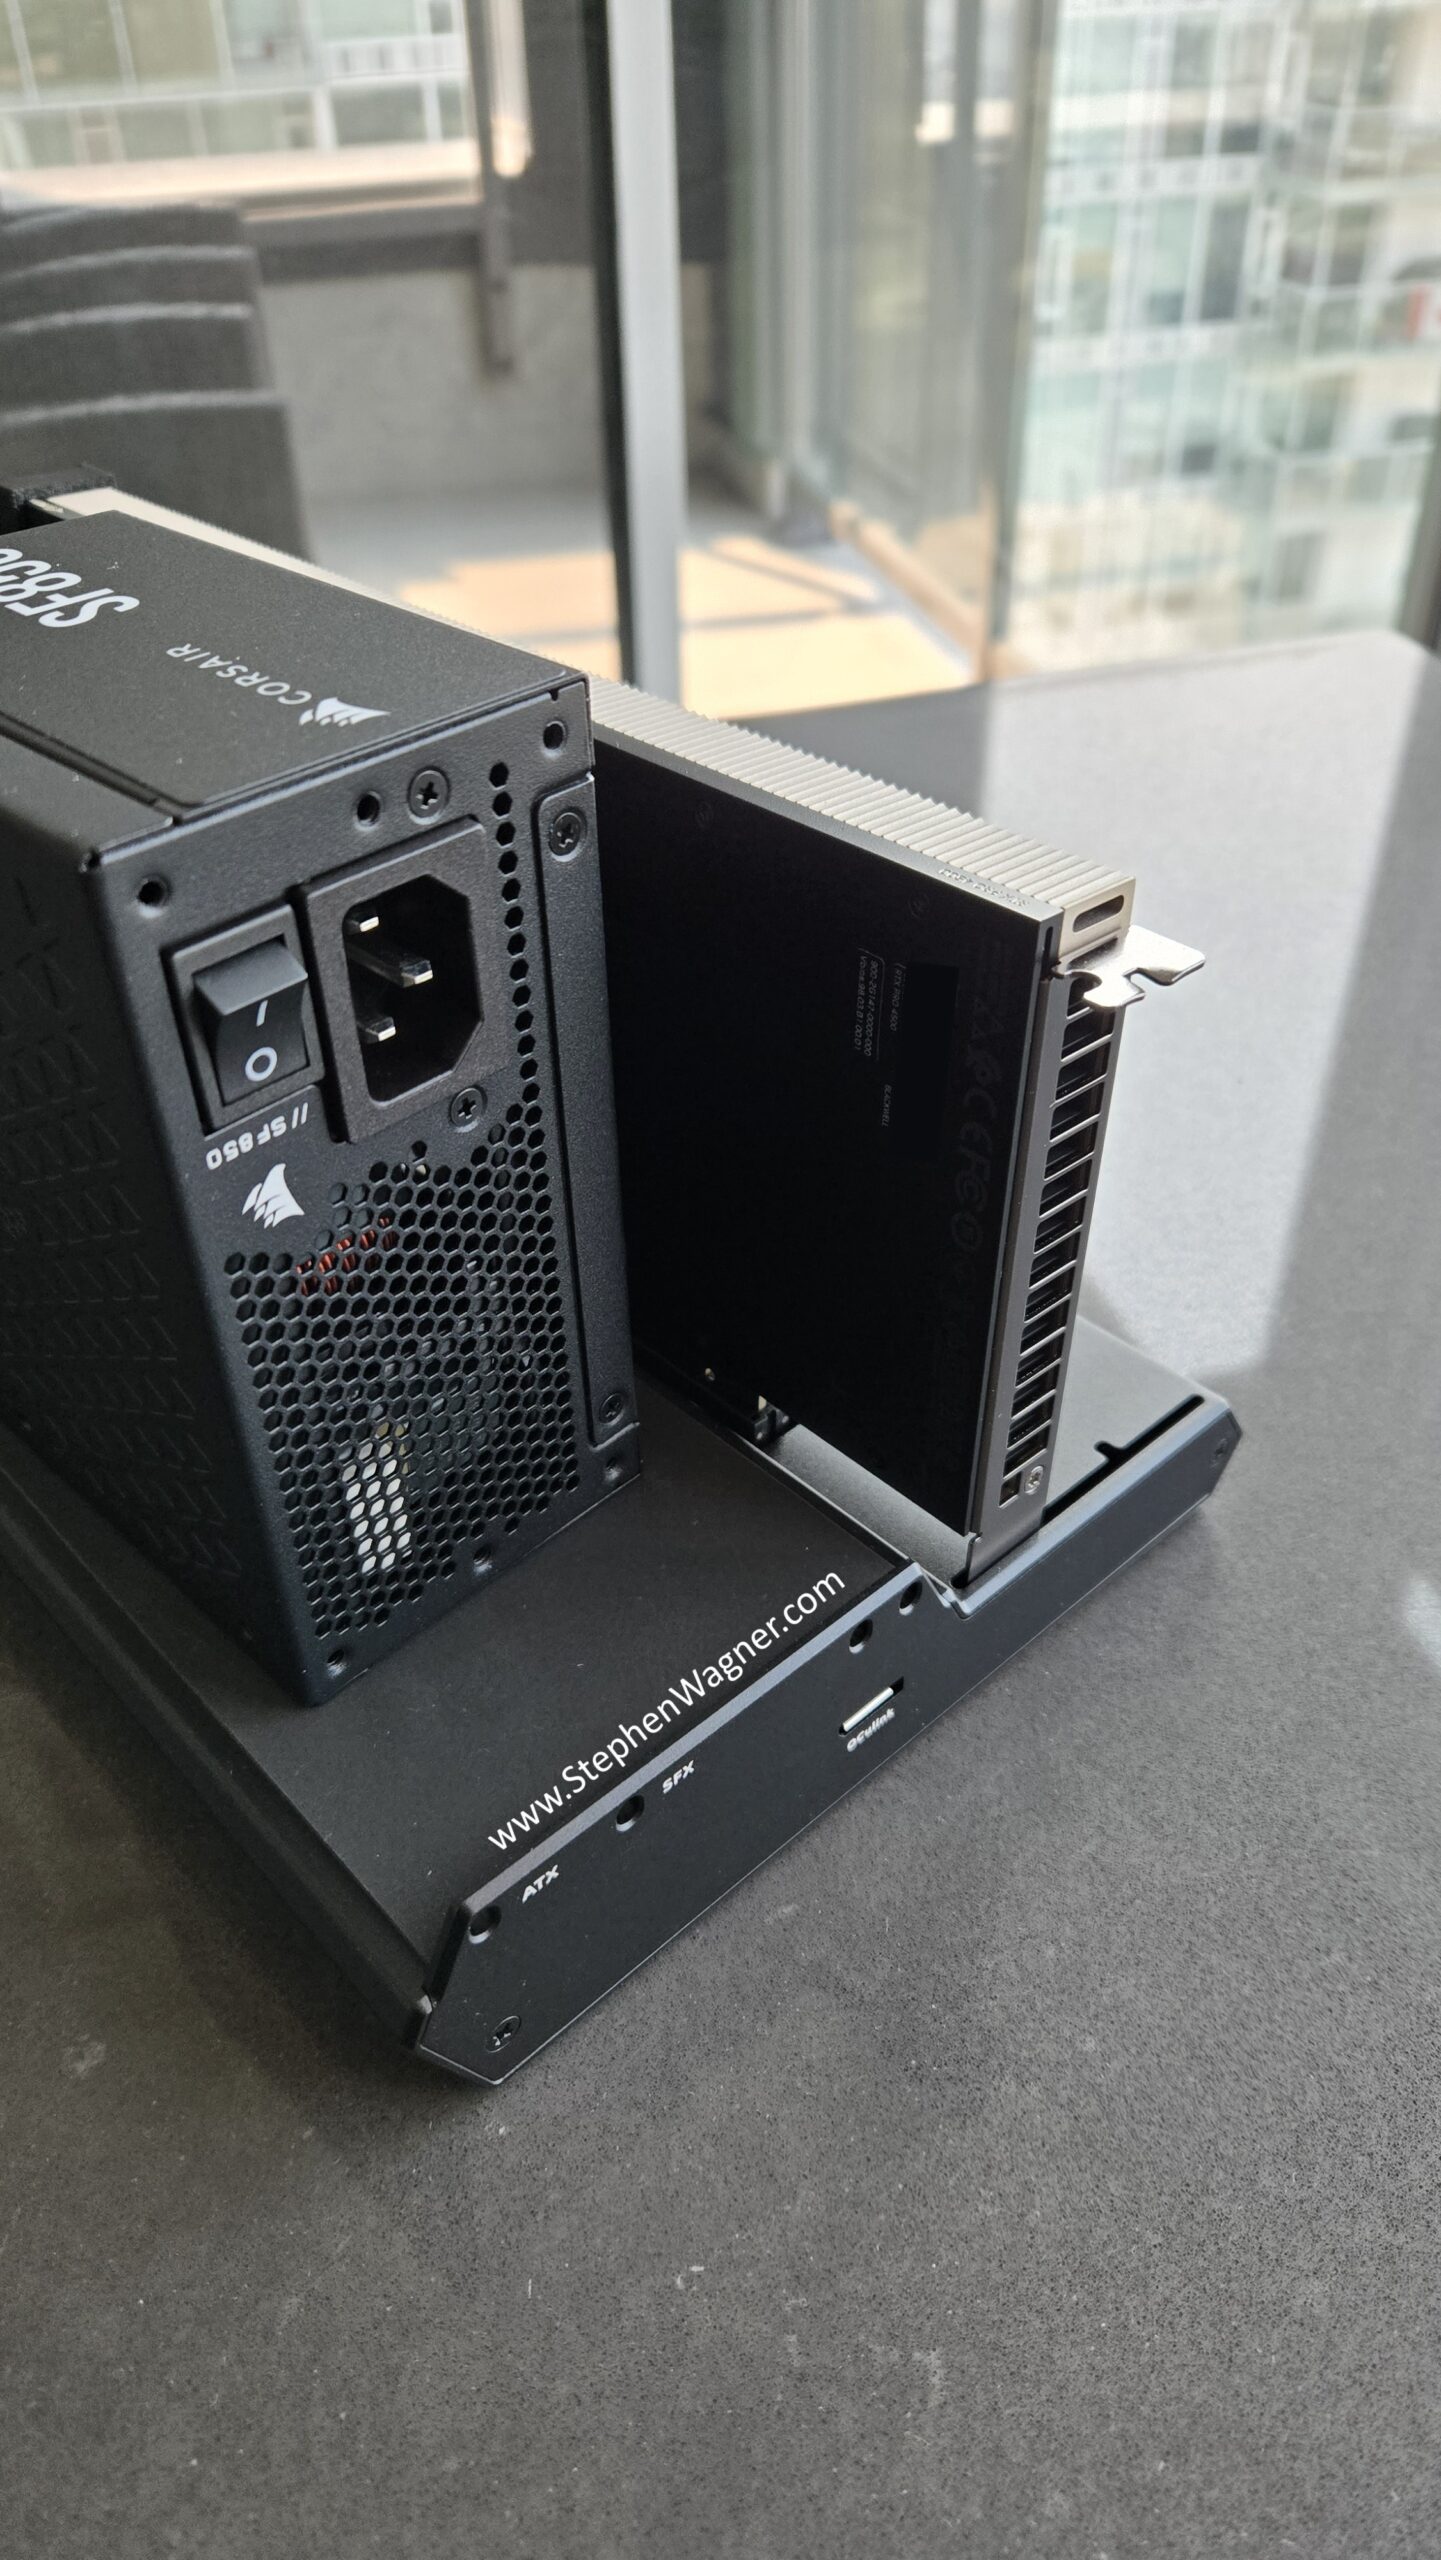
On the other end of the OCuLink cable, I connect the Minisforum DEG1 eGPU dock. Below is a picture of the unit.
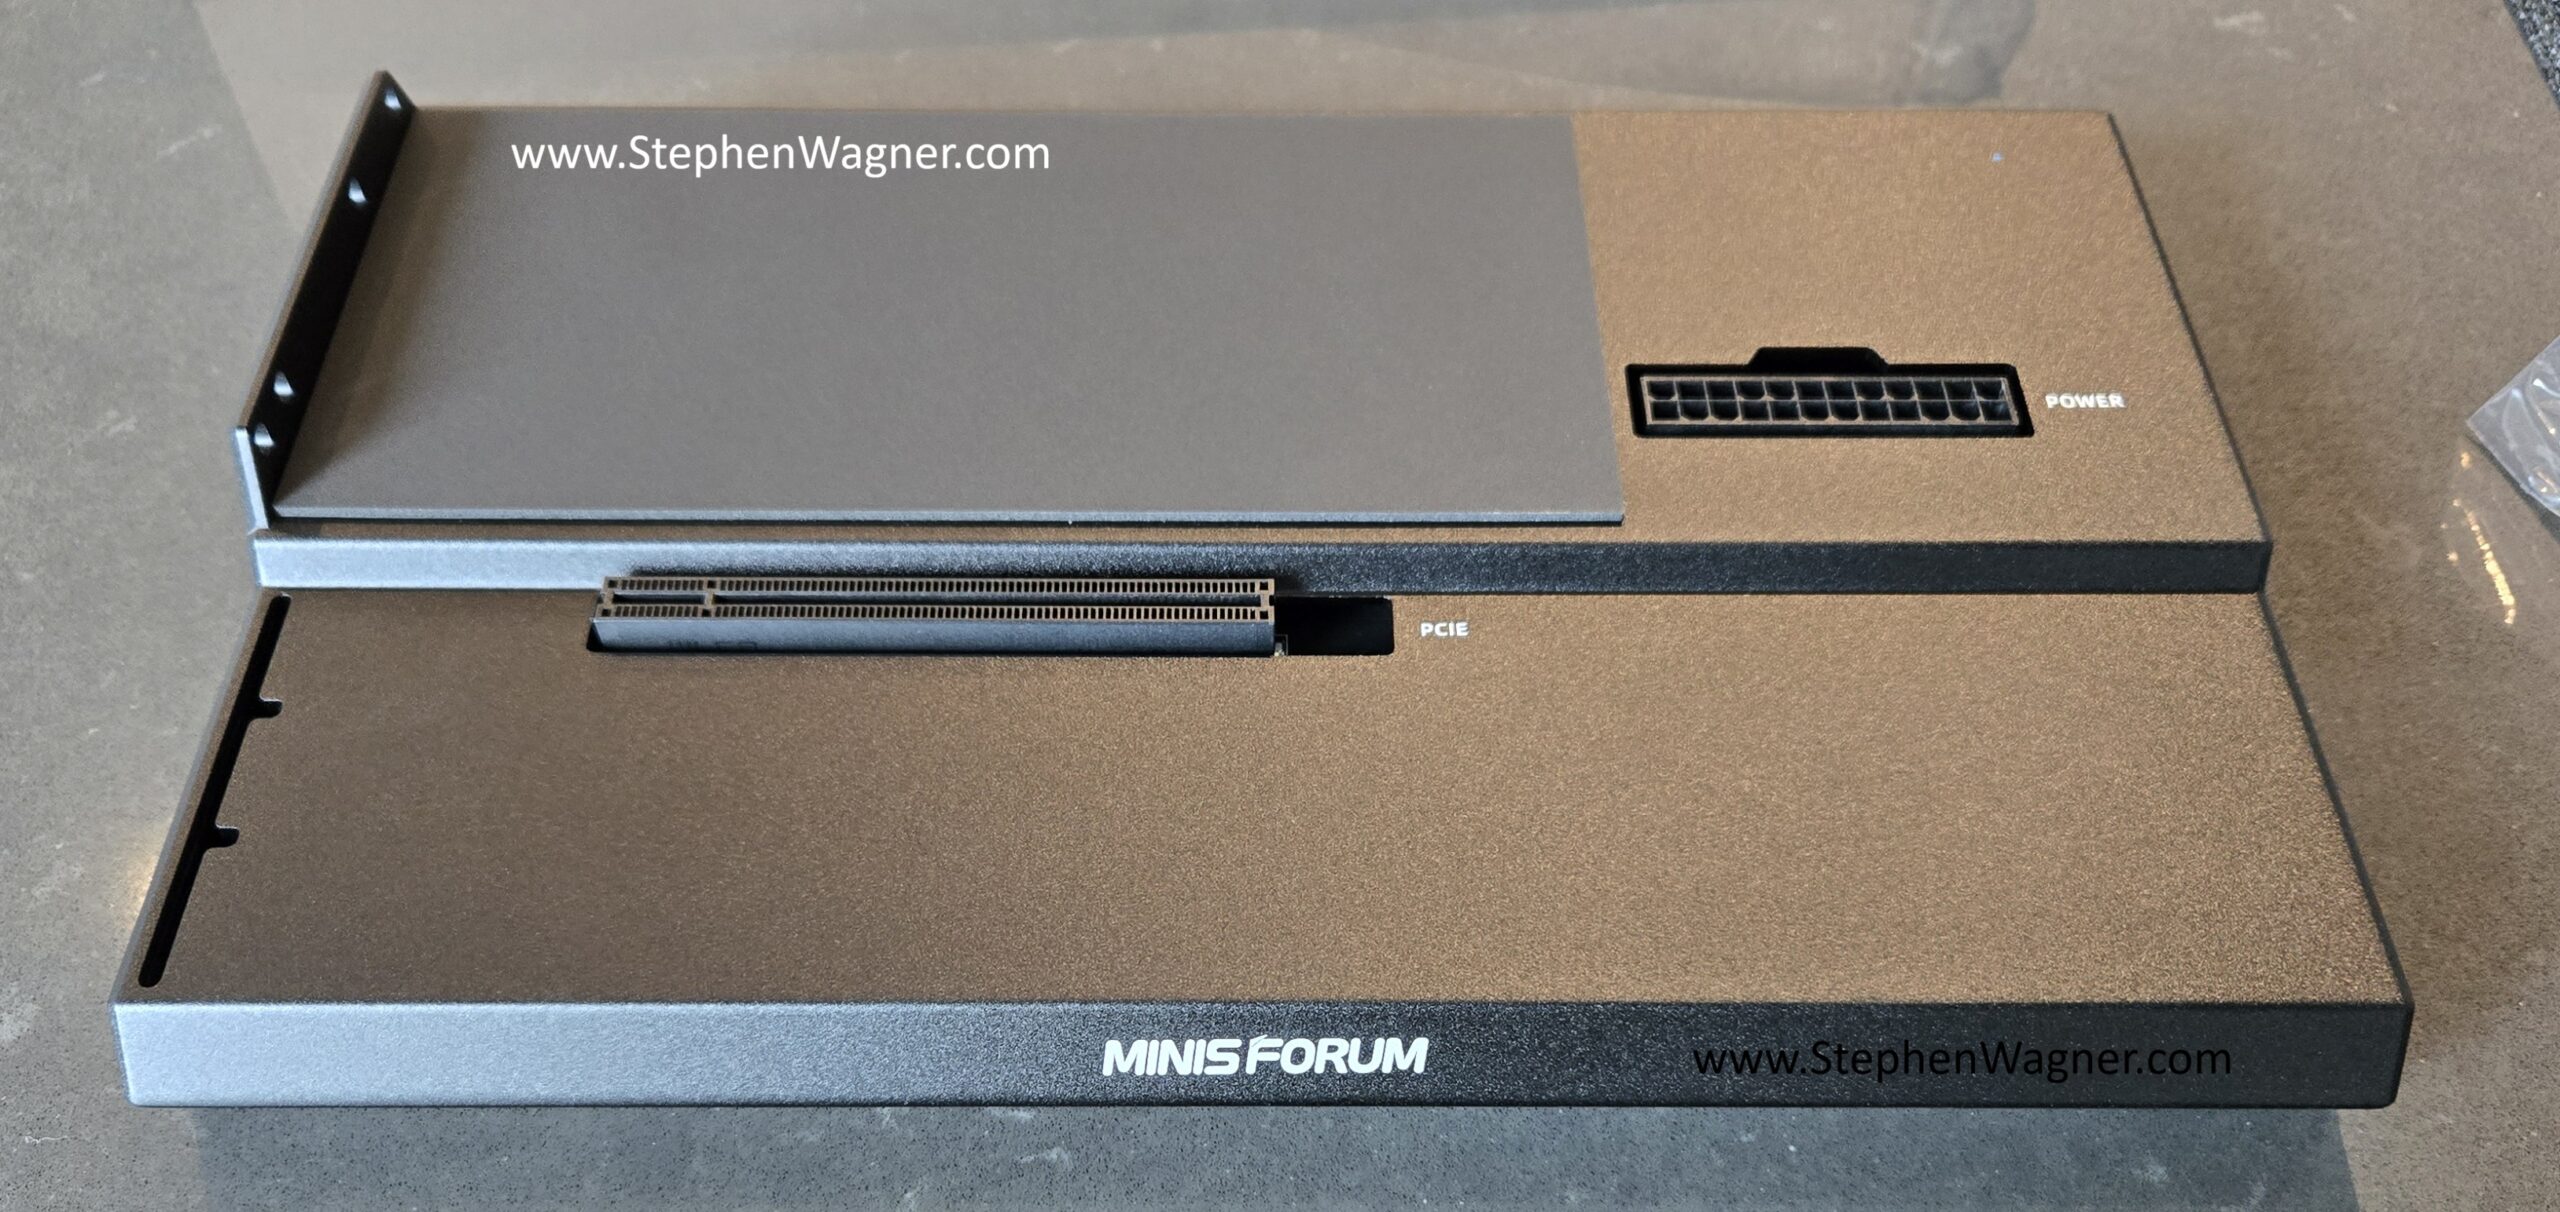
You can use an ATX Power supply to power both the DEG1 dock, along with your preferred GPU.
NVIDIA RTX 4500 Blackwell Server Edition Datacenter GPU
In this specific test, I decided to use the new NVIDIA RTX Pro 4500 Blackwell Server Edition Datacenter GPU. This card is built off the NVIDIA Blackwell GPU architecture, has 32GB of GDDR7 memory, consumes 165W, and has a PCIe 5 x16 interface.
Please note:
- Due to OCuLink being used in this PoC, only 4 lanes will be supplied to the GPU using this configuration.
- I used a 3D printed air baffle and fans I purchased on eBay to cool the car (as the card is passively cooled).
Installing the card was fairly easy:
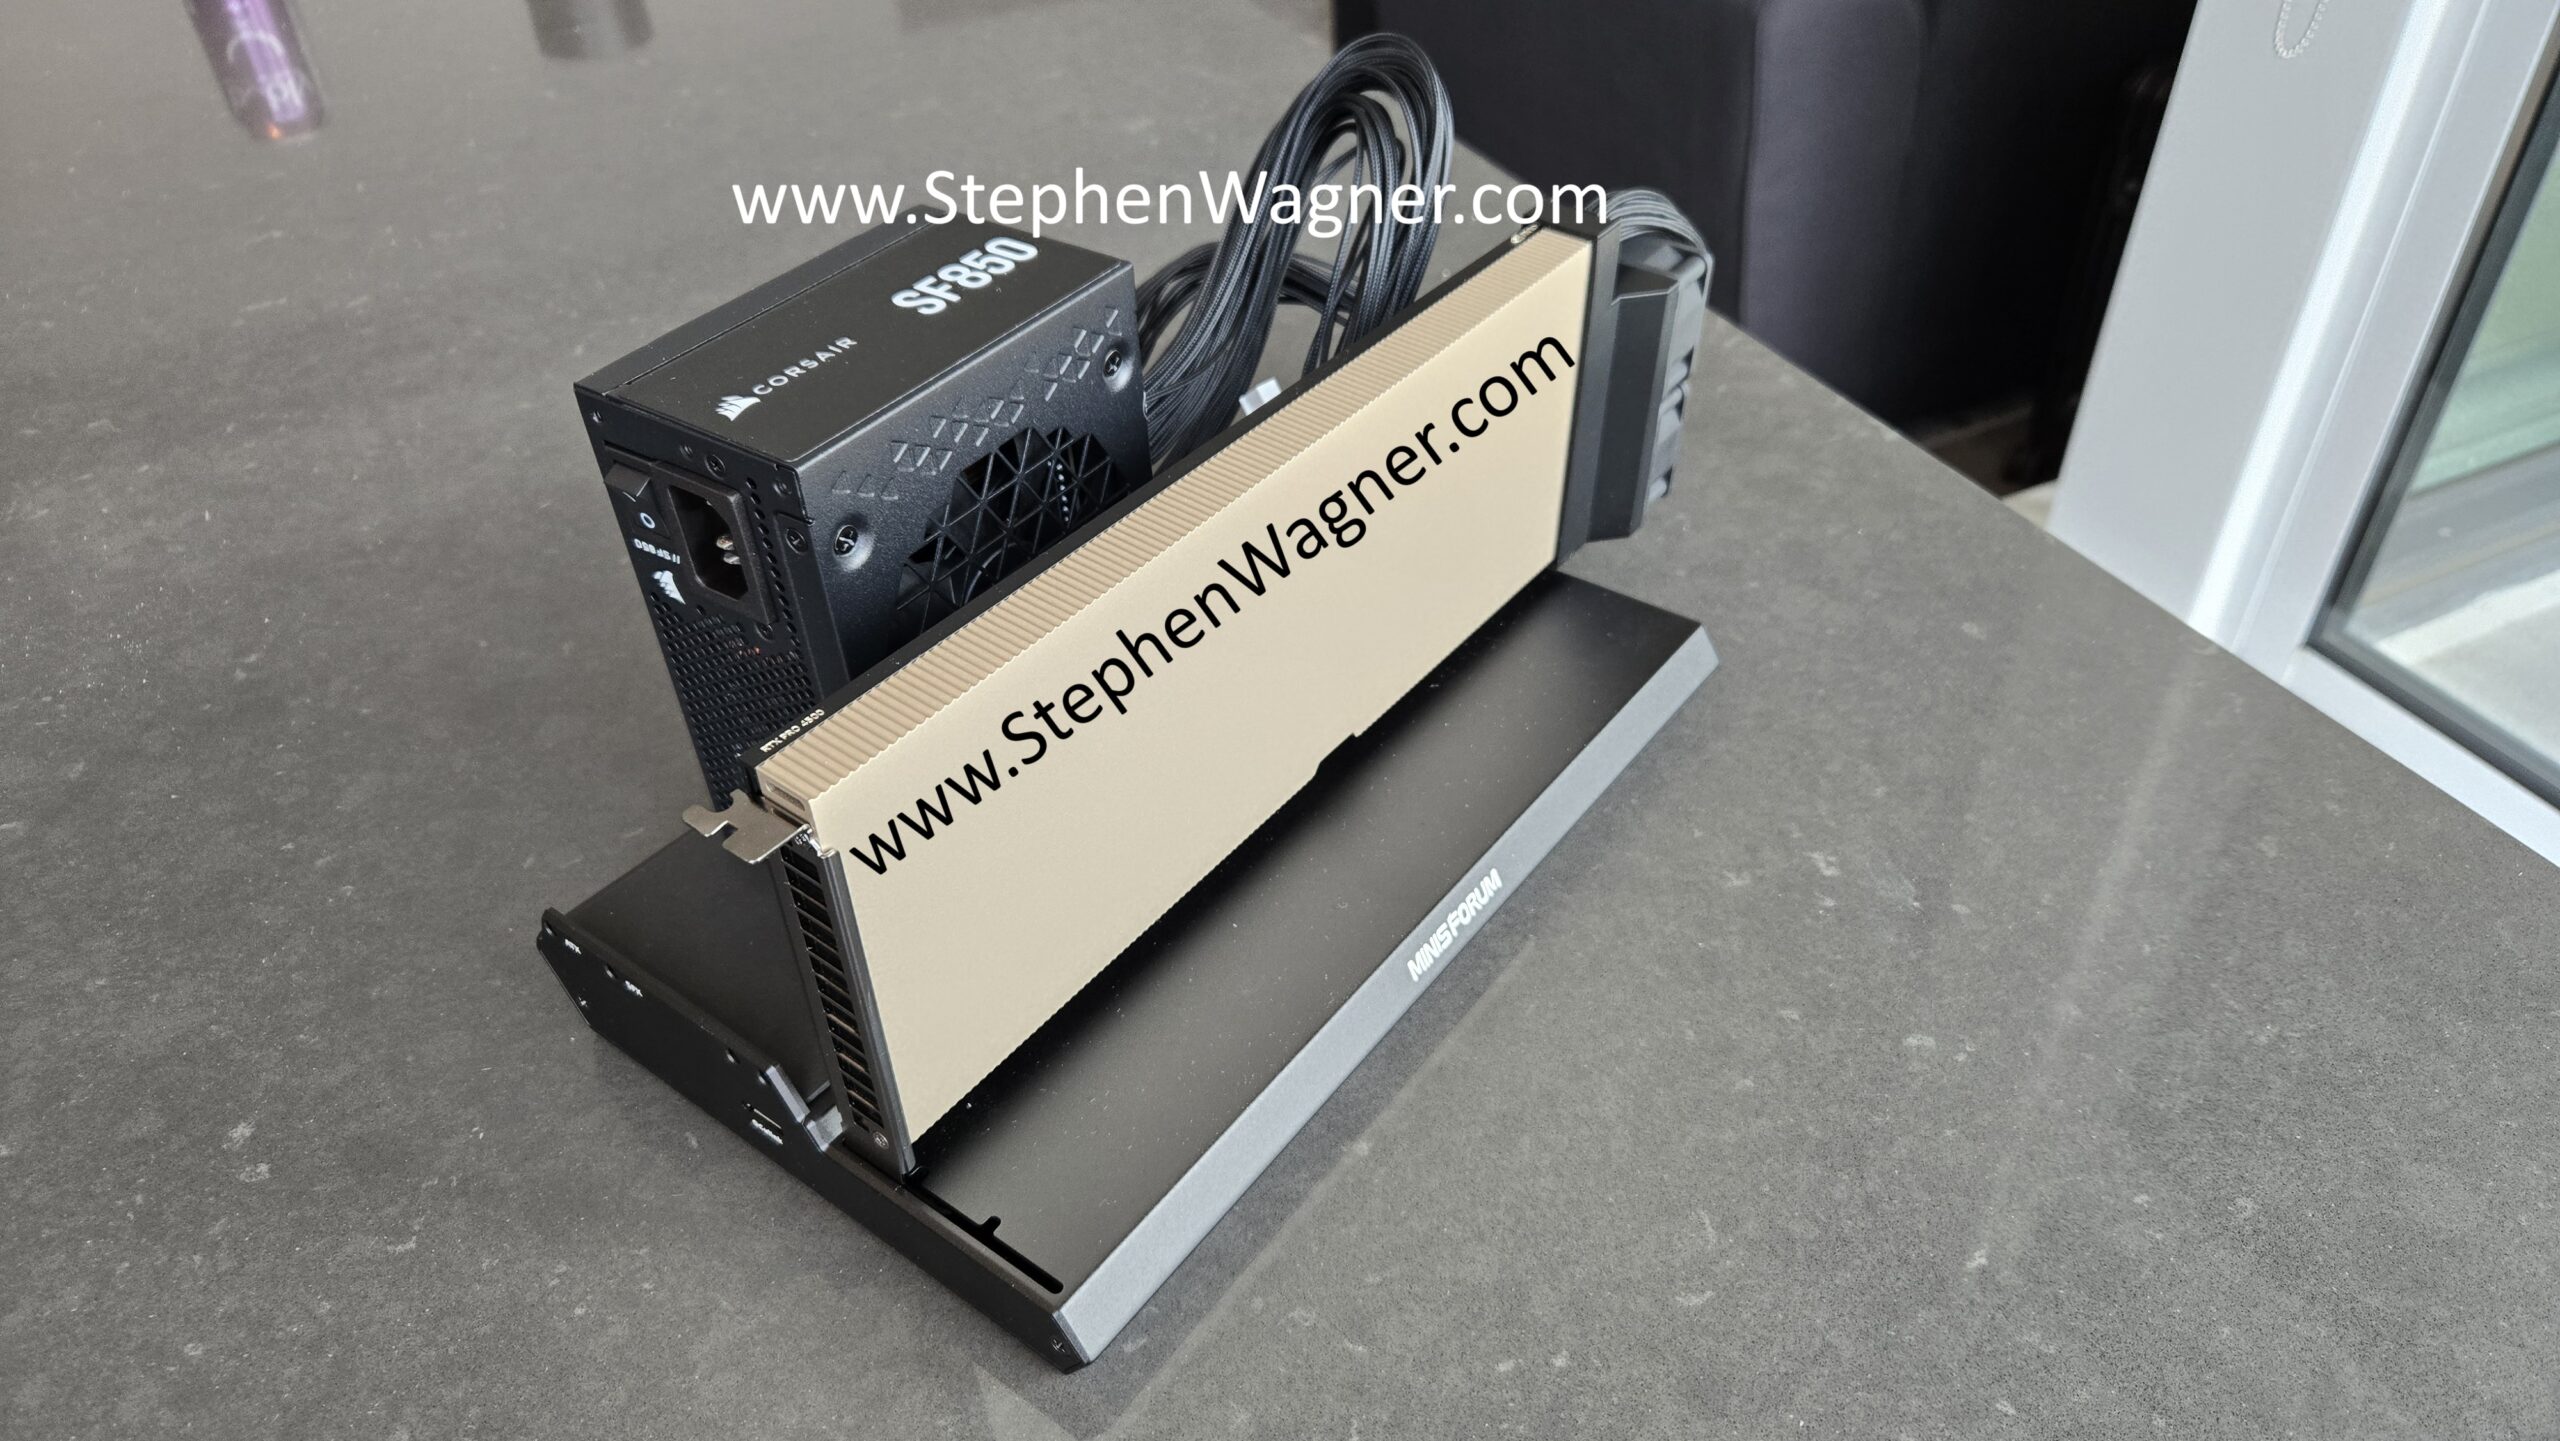
Again, pretty clean and nice looking install.
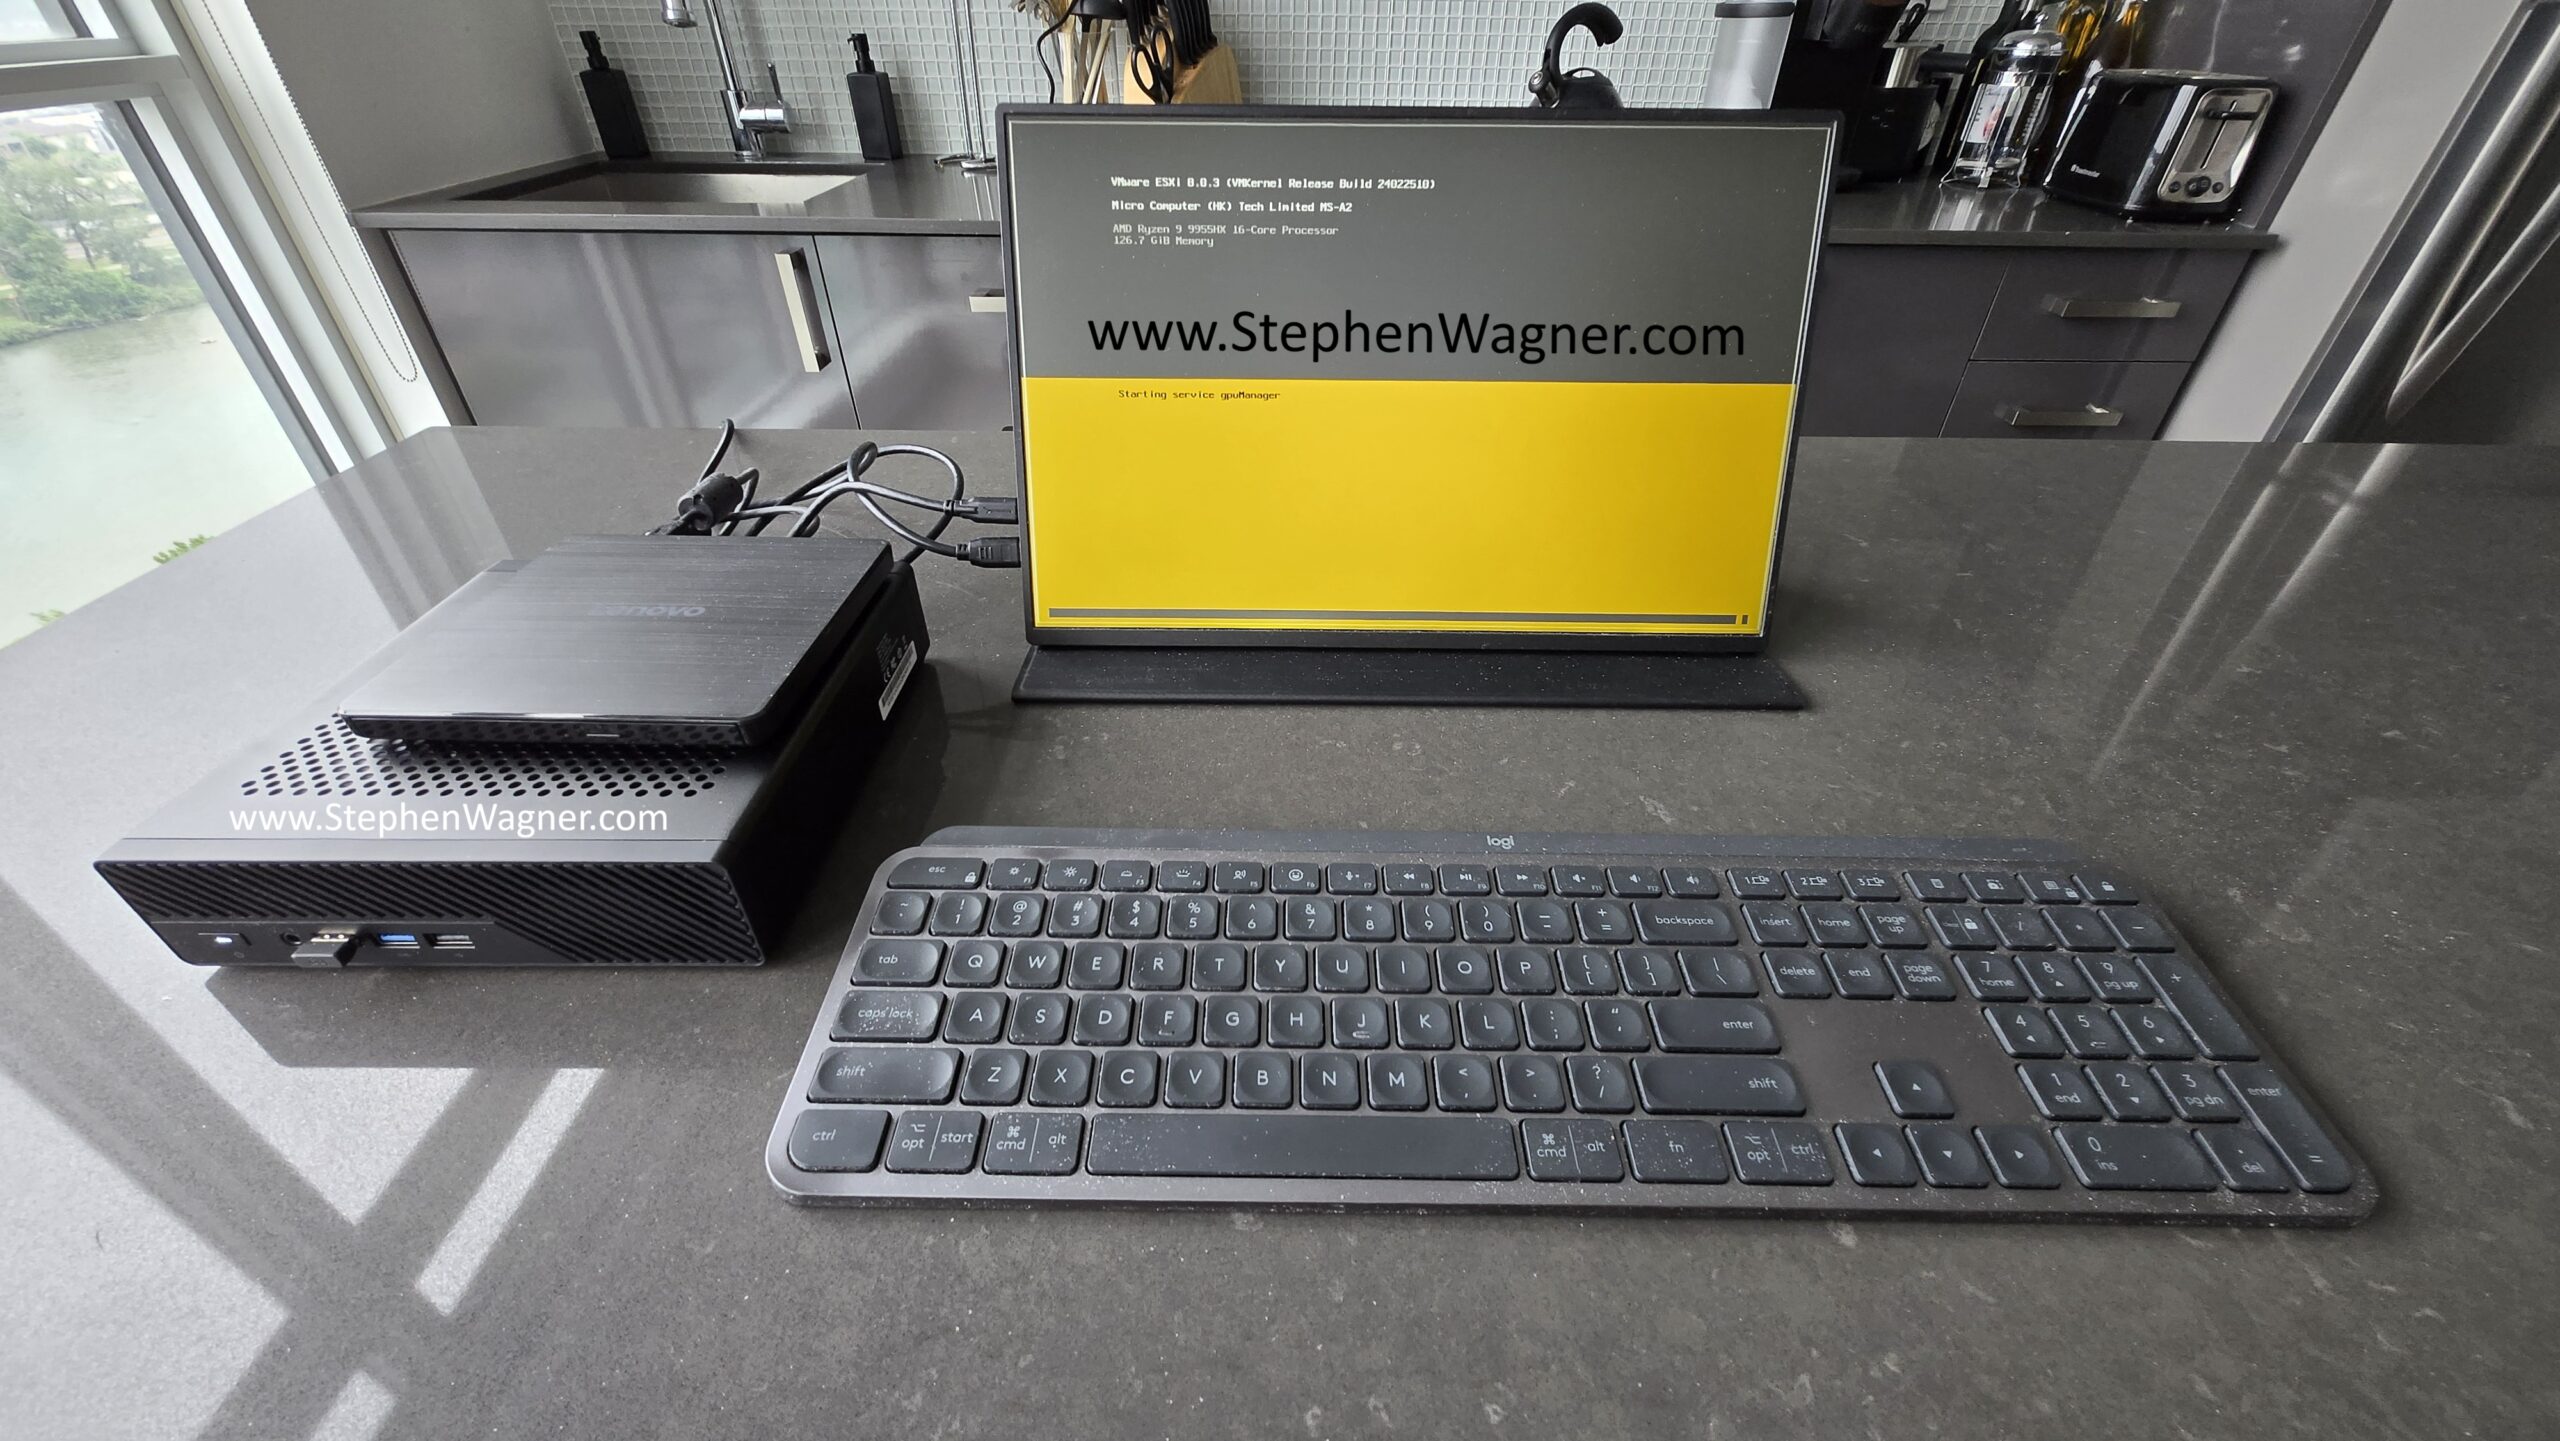
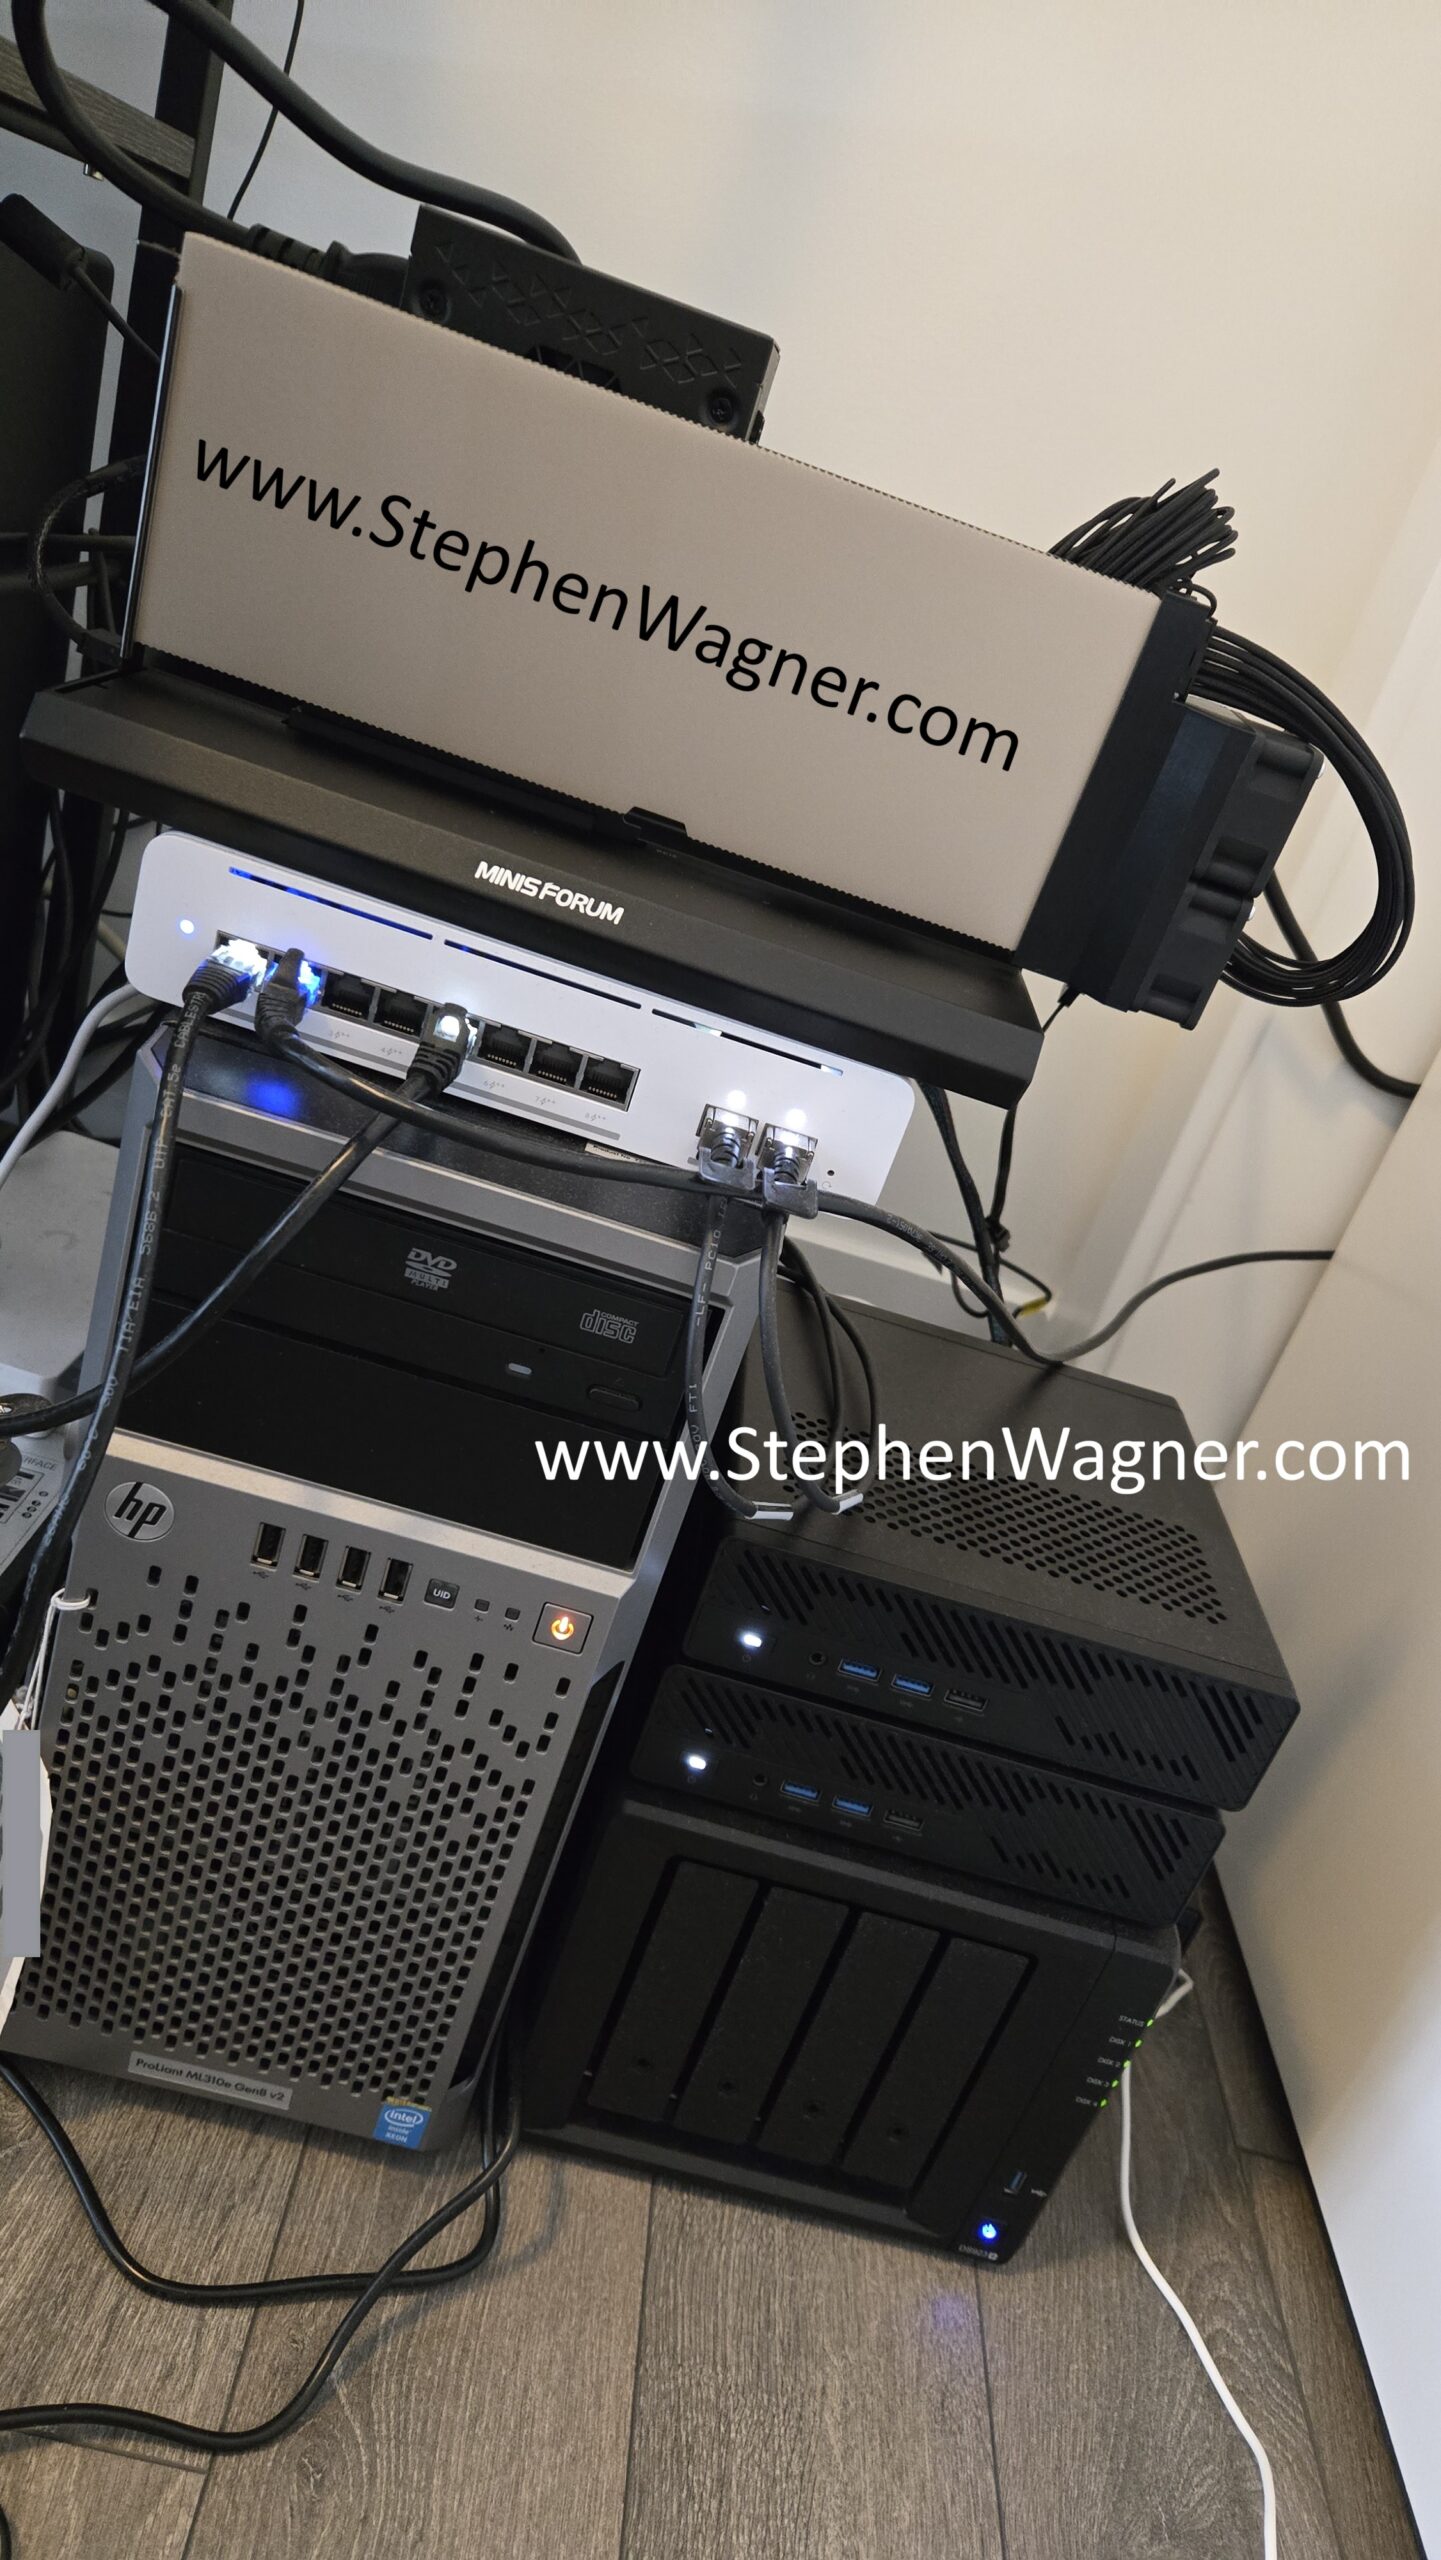
Moving the DEG1 over to my MS-A2 in my homelab, in excitement I quickly connected it.
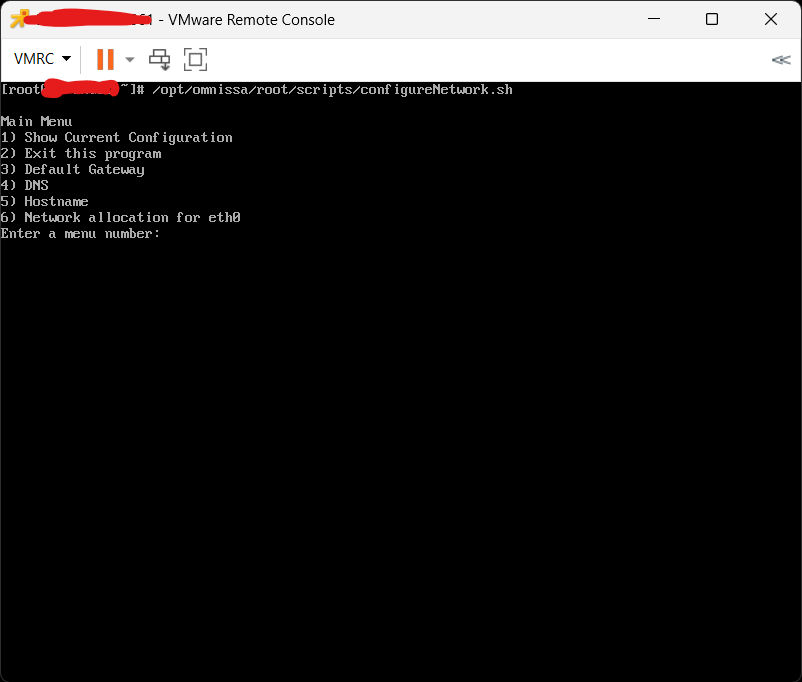
After powering it on and waiting for VMware vSphere ESX to boot, I checked the Graphics Devices section in on the ESX host (I already had the latest NVIDIA vGPU 20.1 drivers in the ESX lifecycle image, so the drivers were present on the host).
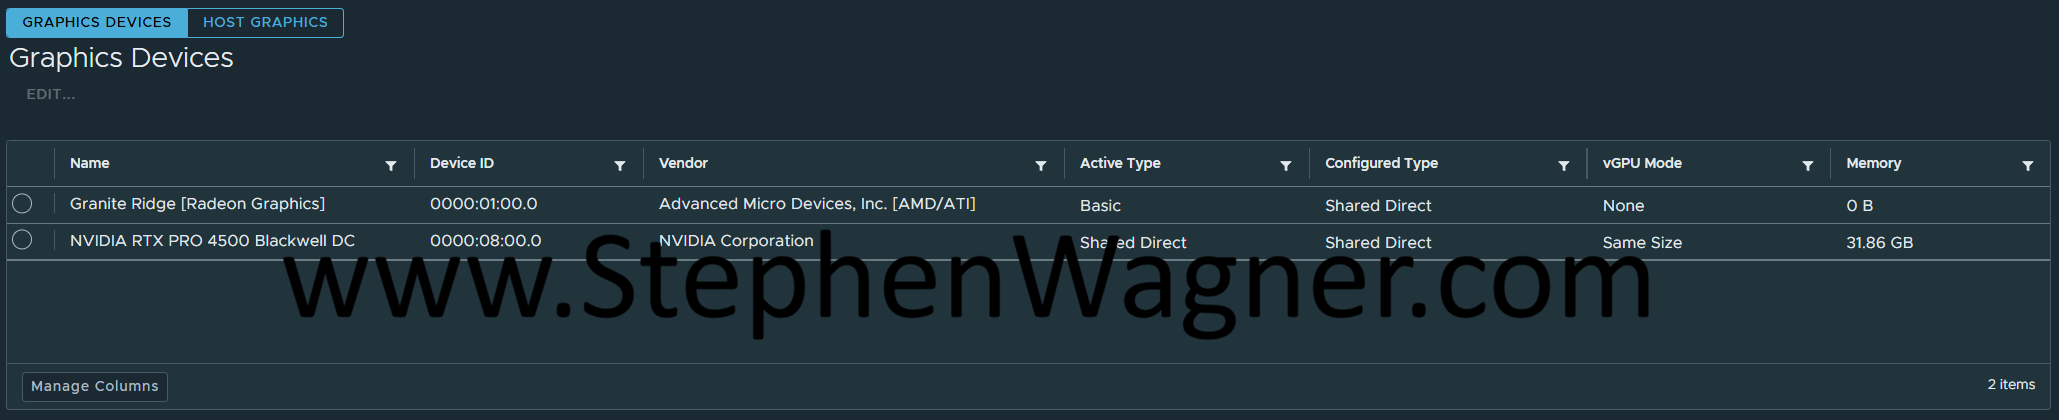
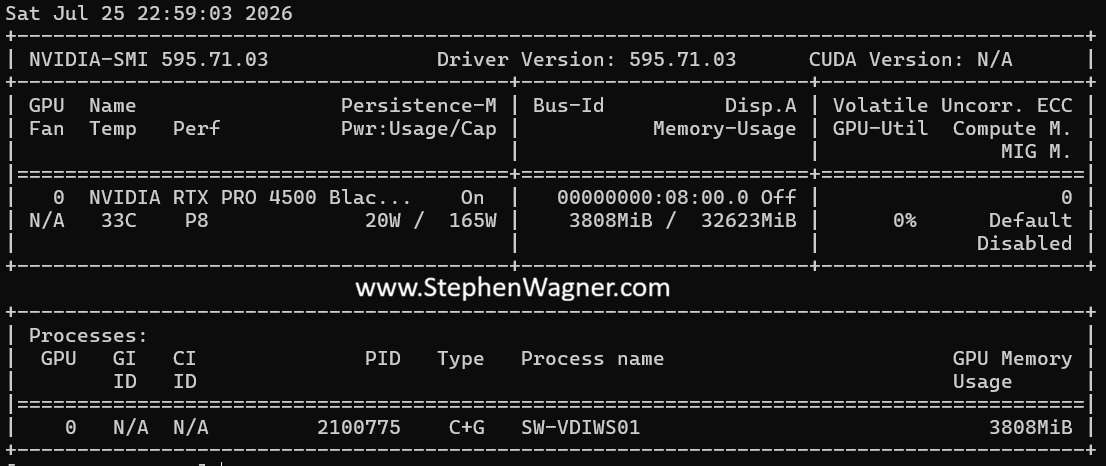
Confirming that the card was detected and host vGPU drivers loaded, I proceeded to attach a vGPU profile (4Q) to a test VM, disable the vGPU framerate limiter, and powered on the VM. I then enabled SSH, connected to the host via SSH, and ran “nvidia-smi” to query the GPU status.
Testing
I went ahead and used Omnissa Horizon to connect to the VDI VM using Blast. This resulted in a high quality hardware encoded/decoded session using NVENC AV1 as the automatically negotiated encoder.
While running through some normal applications, the temperature fluctuated on the card between 33-38C. Note that the fans I’m using are 12V fans, however they were underpowered during this testing and running at 5V.
Loading up Heaven Benchmark, running a test at 1080p using high setting, I was able to achieve 699fps continuously. During this period, the card showed “GPU-Util” in the 90 percentile, and temperatures raised to 80-83C.
Overall, for a quick proof of concept, this was a great test and I’m super happy all the components worked out together.