Joe Cooper and I (Stephen Wagner), talk about AI Prototyping and AI Development with NVIDIA vGPU powered Virtualized Workstations.
Using NVIDIA vGPU technology, NIMs (NVIDIA Inference Microservices), and VDI you can enable high powered, private, and secure AI Development Workstations.
These environments can be spun up on your VMware infrastructure using NVIDIA datacenter GPUs, NVIDIA NIMs, and using Omnissa Horizon or Citrix for delivery.
When upgrading VMware ESXi hosts using VMware vCenter, and vLCM (vSphere Lifecycle Management), you may notice a failure to upgrade and remediate with vLCM and vGPU on ESXi.
This error appears in tasks as a general failure. Inside of vLCM when monitoring remediation, you’ll see an error in regards to a service, module, or VIB that is currently in use which blocks the update and/or upgrade.
Cause
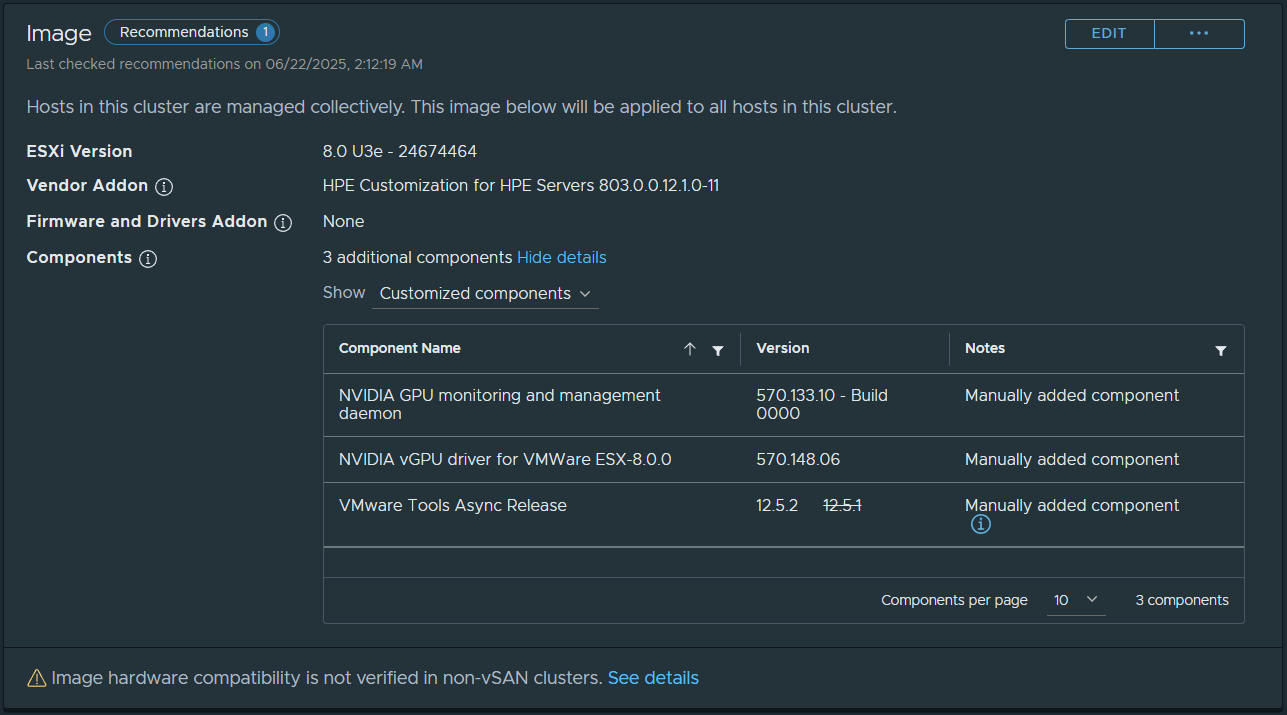
I suspect this is occuring with vGPU release 18.3 (host driver 570.158.02) due to the fact that the host driver has a version change, however the GPU monitoring and management daemon does not (stays at 570.148.06). Since the GPU daemon isn’t touched, the services do not stop, which keeps the NVIDIA ESXi vGPU host driver loaded in the kernel, stopping the vLCM remediation from completeling.
Resolution
I tried a number of different things to resolve this, such as stopping services, re-attempting, then attempting to unload the NVIDIA vGPU kernel driver, however none of these provided a quick fix.
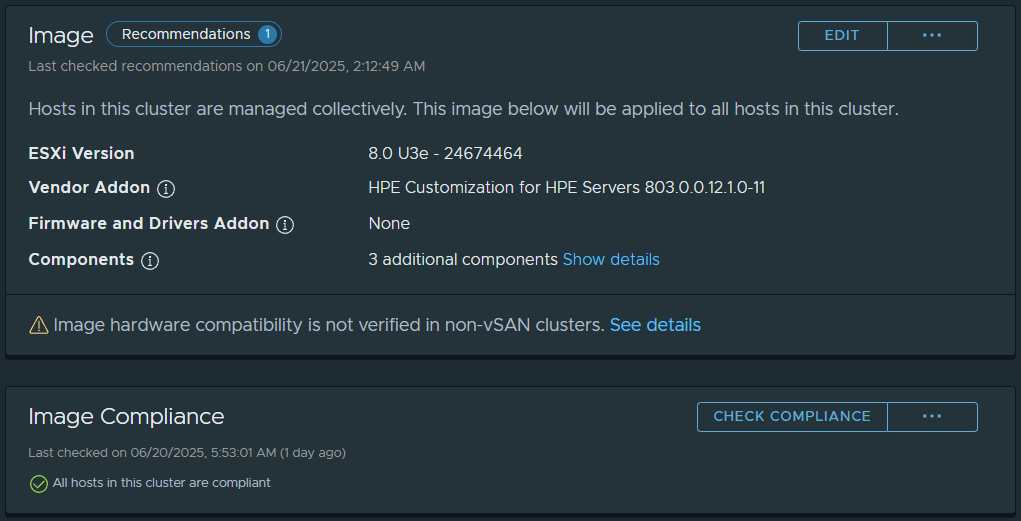
To resolve this issue, I stopped all the NVIDIA services, uninstalled the vGPU host driver and management daemon, restarted the host, checked compliance, and then remediated the host. Remediation completes succesfully.
Steps to perform these actions:
Place the host in maintenance mode
SSH in to the ESXi host
Run the following command to identify the NVIDIA driver and GPU management daemon:
esxcli software vib list | grep -i NVD
This will return the NVIDIA VIBs, example below:
NVD-VMware_ESXi_8.0.0_Driver
nvdgpumgmtdaemon
Stop the NVIDIA vGPU and related services using the following commands (some of these may already be stopped):
/etc/init.d/nvdGpuMgmtDaemon stop
/etc/init.d/gpuManager stop
/etc/init.d/xorg stop
Uninstall the NVIDIA vGPU Host Driver, and Management daemon using the following commands:
A friendly reminder that it’s time to upgrade (or start planning) since VMware vSphere 7 is reaching end of life on October 2nd, 2025. This means that if you’re running VMware vSphere 7 in your environment, VMware will no longer release updates, security patches, and/or provide support for your environment.
Please note: You will require an active subscription to be entitled to, and also have access to the updates and upgrades. You’ll also want to check the interopability and HCLs to make sure your hardware is supported.
Upgrade Path for VMware vSphere Standard, vSphere Enterprise Plus)
It’s never been a better time to upgrade (literally) with the pending EOL. For customers running VMware vSphere Standard (VVS) or those with with VMware vSphere Enterprise Plus subscriptions, your upgrade path will be to vSphere 8.
Upgrade Path for VMware vSphere Foundation, VMware Cloud Foundation
For customers who are currently licensed for VMware vSphere Foundation (VVF), or VMware Cloud Foundation (VCF) subscriptions and licensing, you’ll be able to either upgrade to vSphere 8 products, or the nice and shiny new VMware vSphere Foundation 9 (VVF 9), or VMware Cloud Foundation 9 (VCF 9).
Upgrading VMware vCenter Server
You’ll always want to upgrade your VMware vCenter instance first (except when using VCF, as the procedures are different and out of the scope of this post). Just a reminder that this is a generally easy process where, using the installer, a new VM is deployed using the vCenter Server Installer ISO. The workflow then migrates and upgrades your data to the new appliance, shutting down the old.
Always make sure to perform a VAMI file-based backup, in addition to a snapshot of the previous vCSA appliance. I usually disabled DRS and HA before the backup/snapshot as well, as this allows easier recovery in the event of a failed vCenter upgrade.
Upgrading VMware ESXi Hosts
When it comes to your VMware ESXi hosts (as I recommend to customers), use vLCM (VMware Lifecycle Management) and Image Based Updates if possible as this makes the upgrade a breeze (and supports QuickBoot). Note that baselines updates are deprecated.
If the hardware in your cluster comes from a single vendor (example, HPE, Cisco, Dell), you can use cluster based (and cluster focused) vLCM Image based updates.
When you change your cluster to Image based Updates (irreversable for the cluster once created), you’ll be able to choose your target ESXi version, specify the Vendor add-on, and then customize additional components (such as adding the NVIDIA vGPU Host Driver and GPU Management daemon, storage plugins, etc).
After creating your image, you’ll then be able to apply it to your hosts. This can be used for minor updates, and also larger upgrades (such as VMware ESXi 7 to 8).
In some scenarios, you may encounter an issue where the Veeam WAN Accelerator service fails to start.
This will cause backup and backup copy jobs to fail that use the Veeam WAN Accelerator, which is how this issue is usually first diagnosed.
In this post I’ll explain the problem, what can cause it, and how to resolve the issue.
The Problem
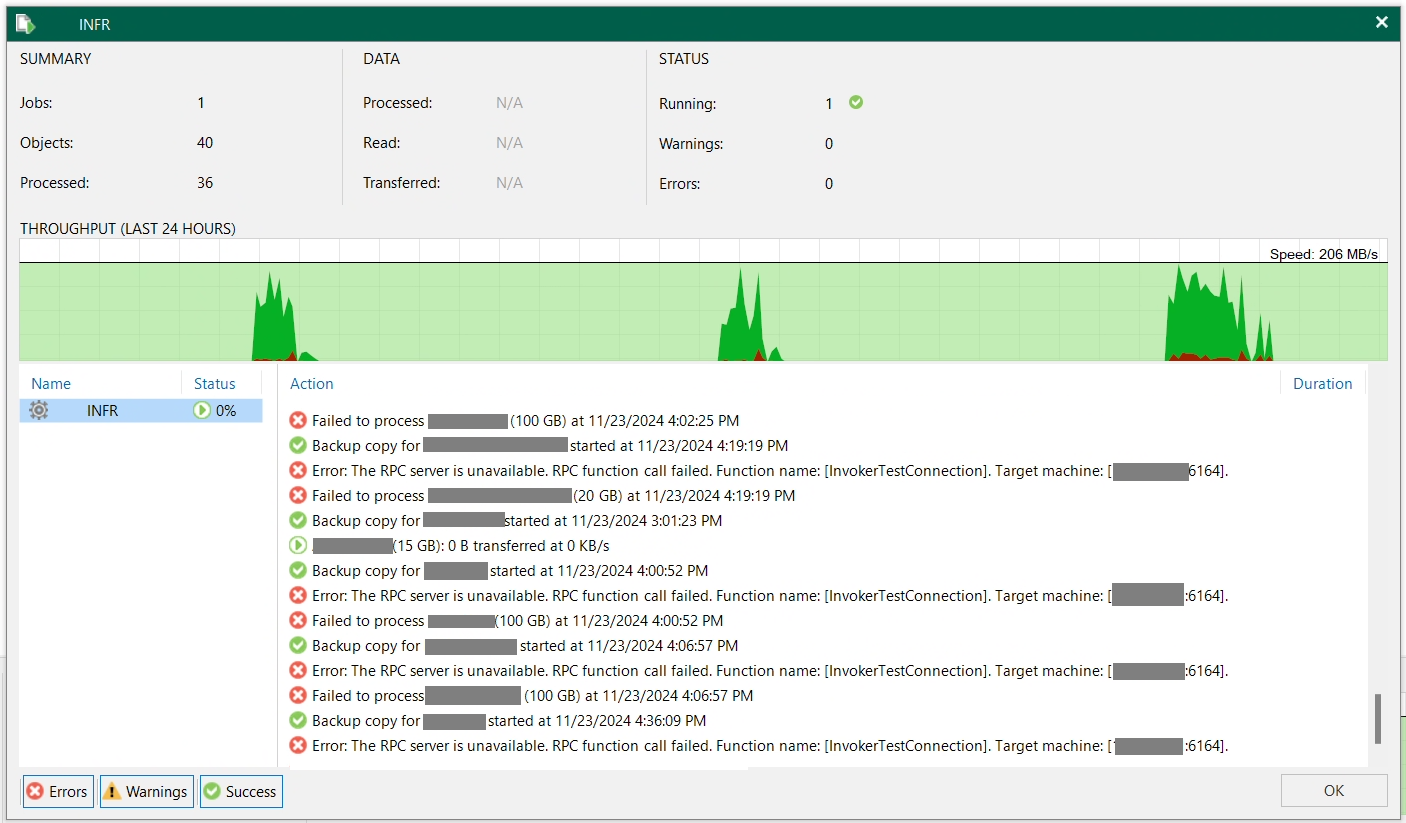
When this issue occurs, and when a Backup or Backup Copy job runs, it will usually first fail with the following error from the Veeam console:
Error: The RPC server is unavailable. RPC function call failed. Function name: [InvokerTestConnection]. Target machine: [IP.OF.WAN.ACC:6464].

Failed to process (VM Name).
See below for a screenshot of the example:
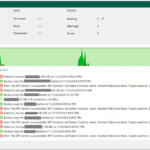
From the error above, the next step is usually to check the logs to find out what’s happening. Because this Backup Copy job uses the WAN accelerator, we’ll look at the log for the Veeam WAN Accelerator Service.
In the Veeam WAN Service log file above, you’ll note a fatal error where the service is unable to find the paths configured, which caused the service to halt and stop.
In some configurations, iSCSI is used to access Veeam backup repository storage hosted on iSCSI targets. Furthermore, in some iSCSI configurations special vendor plugins are used to access the iSCSI storage, and configure items like MPIO (multipath input output), which can take additional time to initialize.
In this scenario, the Veeam WAN Accelerator Service was starting before the Windows iSCSI service, MPIO Service, and Nimble Windows Connection Manager plugin had time to initialize, resulting in the WAN accelerator failing because it couldn’t find the directories it was expecting.
The Solution
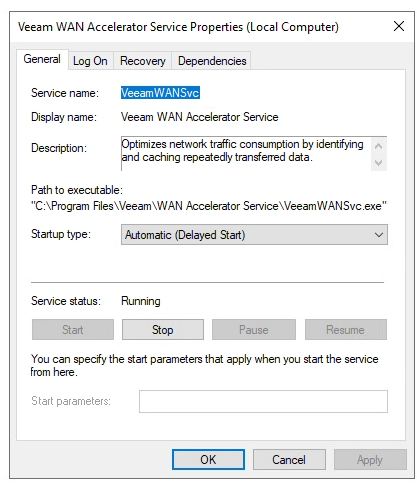
To resolve this issue, we want the Veeam WAN Accelerator Service to have a delayed start on the Windows Server operating system bootup sequence.
Open Windows Services
Select “Veeam WAN Accelerator Service”
Change “Startup Type” to “Automatic (Delayed Start)”
Click “Apply” to save, and then click “Start” to start the service.
As per the screenshot below:
The Veeam WAN Accelerator Service will now have a delayed start on system bootup, allowing the iSCSI initiator to establish and mount all iSCSI Target block devices, before starting the WAN service.
I’m finally back at home after an amazing week at VMware Explore 2024, in Las Vegas!
As always, VMware Explore 2024 was the place to be, and THE most important conference of the year, at least for me, my clients, and those who need to be in the know.
See below for my insights on the conference, information and links, as well as some videos I created to talk about!
The Focus moving forward
This was the first VMware Explore with VMware by Broadcom. With the acquisition of VMware by Broadcom, there’s been a number of changes they have implemented, including their new strategy moving forward, SKU consolidation, as well as solution refinement.
The focus this year was on VCF, also known as VMware Cloud Foundation, with the announcement of VCF 9.0, and enabling technologies like AI (Artificial Intelligence) with VMware Private AI Foundation, and NVIDIA AI enterprise.
Why VMware Explore is important for me
For me, VMware Explore is important because of a number of different things. A brief of this is:
VMware By Broadcom
Strategy
Product Releases
Technical Sessions (Learning, Training)
Hands on Labs (HoL)
Community
VMUG – VMware User Group
VMware vExpert
Networking
Reconnecting in person with clients in other cities (and other countries)
Meeting customers face to face for the first time
New Business
I can’t recommend enough how important VMware Explore is for career development. It’s a face paced conference, and you won’t have time to do everything you plan and want to, but you just need to go with the flow and let it happen naturally.
Technical Sessions
There was a number of AMAZING technical sessions, which are all available via the VMware Explore content catalog (click the link to view).
You can also view various community sessions, by going to VMware TV Live (click for link).
Check out my videos on VMware Explore 2024
I hope you enjoy the videos I created covering VMware Explore during the experience, and after.
VMware Explore 2024: A chat with Matt Heldstab about VMUG and Community
In this video, I sat down with Matt Heldstab, Global VP for VMUG (VMware User Group), to talk about the importance of community, VMUG, and how VMware Explore brings everyone together in person. This provides opportunities to reconnect with old friends, make new friends, and share a passion of technology (and VMware By Broadcom solutions).
VMware Explore 2024: A chat with Matt Heldstab about VMUG and Community
VMware Explore 2024: Day 1, Let’s Explore
On Day 1, I chatted with Daniel Keer (owner and writer at theDXT), to talk about his experience at VMware Explore. This was Daniel’s first VMware conference, and large tech conference for that matter.
Daniel was having a blast, commenting on how he was able to connect with VCF experts even before the conference started, and how friendly and welcoming everyone was.
I was able to catch up with Daniel later, and he told me he was enjoying back to back technical sessions, and VMware Hands on Labs.
VMware Explore 2024: Day 3, Talking VCF and AI with Johan van Amersfoort
Johan van Amersfoort (owner/writer at vHojan.nl – Johan van Amersfoort) is a very well known presenter, often presenting on technologies such as EUC (with Omnissa Horizon), and now on AI and the endeavors both in his own home lab, as well as the work his organization is doing for customers with AI.
Johan and I talked about:
VMware Explore recap
Discussion on VCF, Private AI Foundation, and NVIDIA AI Enterprise (NIVIDIA NIMs)
Johan’s Presentations (see below for links)
Enterprise AI Workloads
VMware EUC divestiture (separation of Omnissa)
GPU Discussion
Tanzu, Cloud Foundry
Simplification of IT and Virtualization with VMware VCF
Community
At VMware Explore, Johan had two sessions (click the links to view):
The session covered a real-world practical use of AI in IT, using an LLM to provide insight, analysis, administration, monitoring, and management of the VMware Avi Loadbalancer, using LLMs, with the choice of using Google Gemini in the cloud, or your own LLM on-prem using NVIDIA AI Enterprise, NIMs, and VMware Private AI Foundation.
Cool stuff!
VMware Explore, moving forward…
Moving forward, I’m aligned with and believe in the strategy of Private Cloud first, enabling technologies such as AI, while providing existing solutions such as compute.
This website uses cookies to improve your experience. We'll assume you're ok with this, but you can opt-out if you wish.
Do you accept the use of cookies and accept our privacy policy? AcceptRejectCookie and Privacy Policy
Privacy & Cookies Policy
Privacy Overview
This website uses cookies to improve your experience while you navigate through the website. Out of these cookies, the cookies that are categorized as necessary are stored on your browser as they are essential for the working of basic functionalities of the website. We also use third-party cookies that help us analyze and understand how you use this website. These cookies will be stored in your browser only with your consent. You also have the option to opt-out of these cookies. But opting out of some of these cookies may have an effect on your browsing experience.