Did you know that you can monitor and manage your VMware vSphere environment (ESXi hosts, cluster, and VMs) remotely with the “VMware vSphere Mobile Watchlist” app on your Android phone? Well, you can!
Download link: https://play.google.com/store/apps/details?id=com.vmware.beacon
Please note, shortly after this post, VMware removed the availability of this app. If you had it installed prior, you may continue to use it.
Update – June 12th, 2019: VMware released a new vSphere Mobile Client in alpha. For more information, see my new post at: https://www.stephenwagner.com/2019/06/12/vsphere-mobile-client-android-mobile-devices/
The VMware vSphere Mobile Watchlist (VMware Watchlist) Android App
For some time now, I’ve been using this neat little app from VMware (available for download here) to monitor and manage my vSphere cluster remotely. You can use the app while directly on your LAN, or via VPN (I use it with OpenVPN to connect to my Sophos UTM). I’ve even used it while on airplanes using the on board in-flight WiFi.
The reason why I’m posting about this, is because I’ve never actually heard anyone talk about the app (which I find strange), so I’m assuming others aren’t aware of it’s existence as well.
The app runs extremely well on my Samsung S8+, Samsung S9+, and Samsung Tab E LTE tablet. I haven’t run in to any issues or app crashes.
Let’s take a look at the app
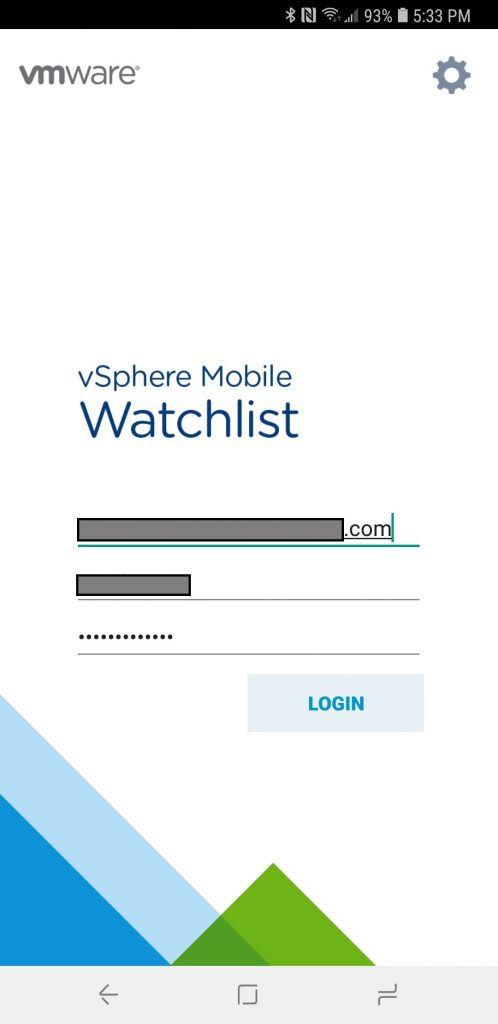
The above screen is where you initially log in. I use my Active Directory credentials (since I have my vCenter server integrated with AD).
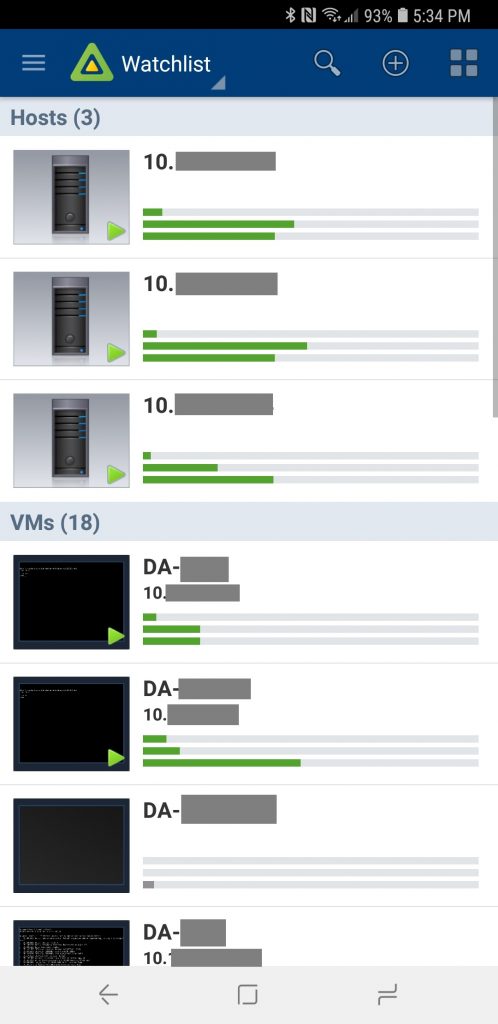
In the default view (shown above), you can view a brief summary of your ESXi hosts, as well as a list of virtual machines running.
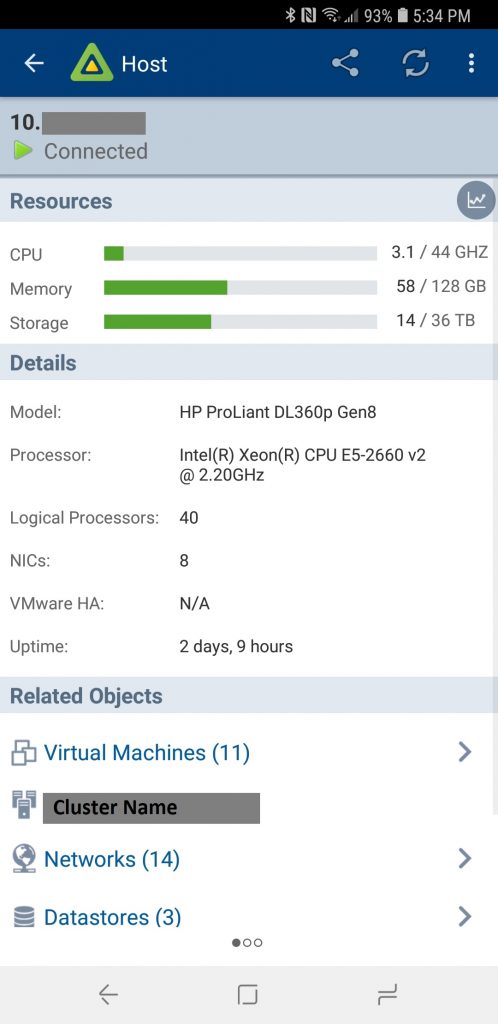
After selecting an ESXi host, you can view the hosts resources, details, related objects, as well as flip over to view host options.
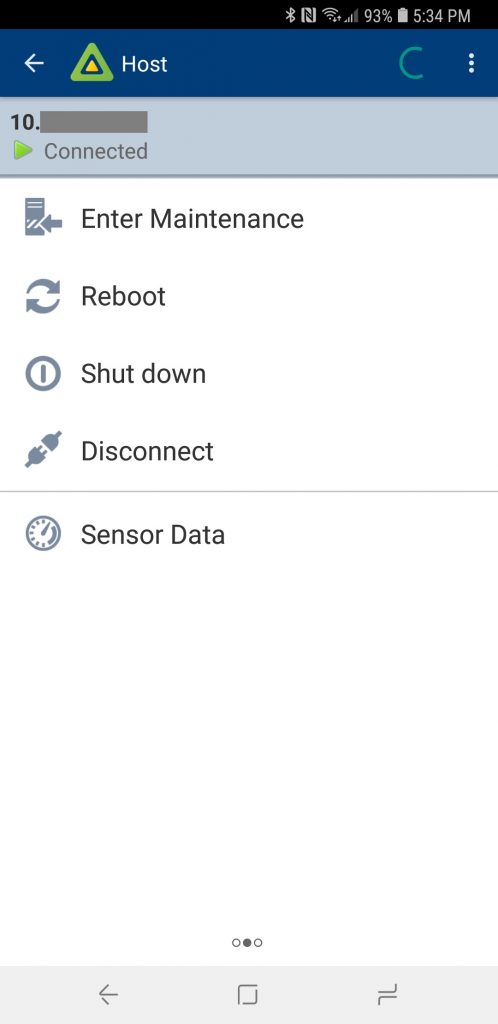
Under host options, you can Enter Maintenance mode, reboot the host, shutdown the host, disconnect the host, or view the hosts’ sensor data.
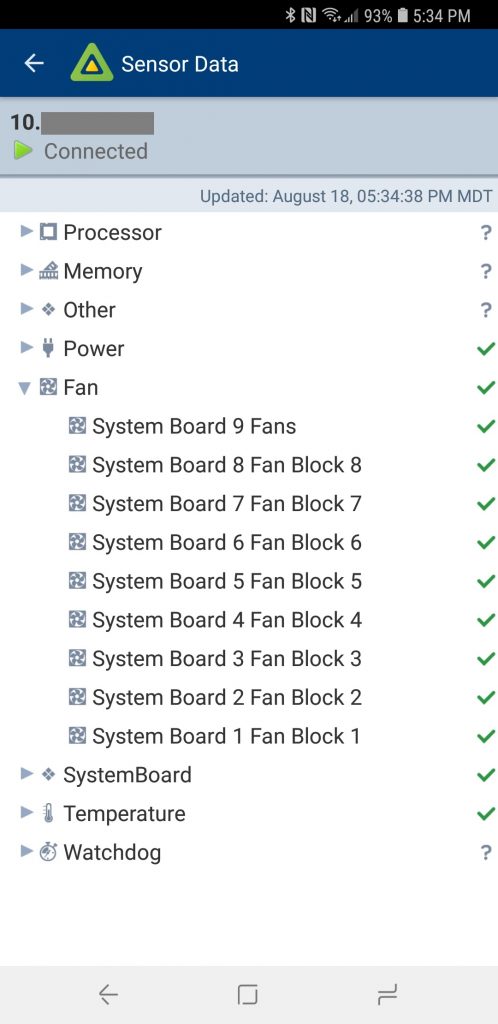
Checking the HPE Proliant DL360p Gen8 fan sensor data with VMware Watchlist.
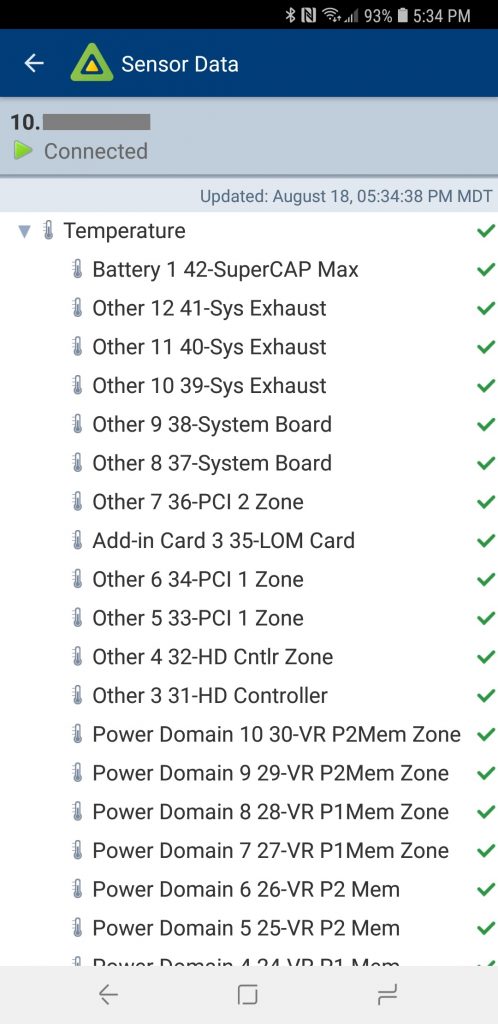
Checking the HPE Proliant DL360p Gen8 temperature sensor data with VMware Watchlist. While not shown above, you can select individual items to pull the actual temperature values. Please Note that the temperature values are missing a decimal (Example: 2100 = 21.00 Celsius).
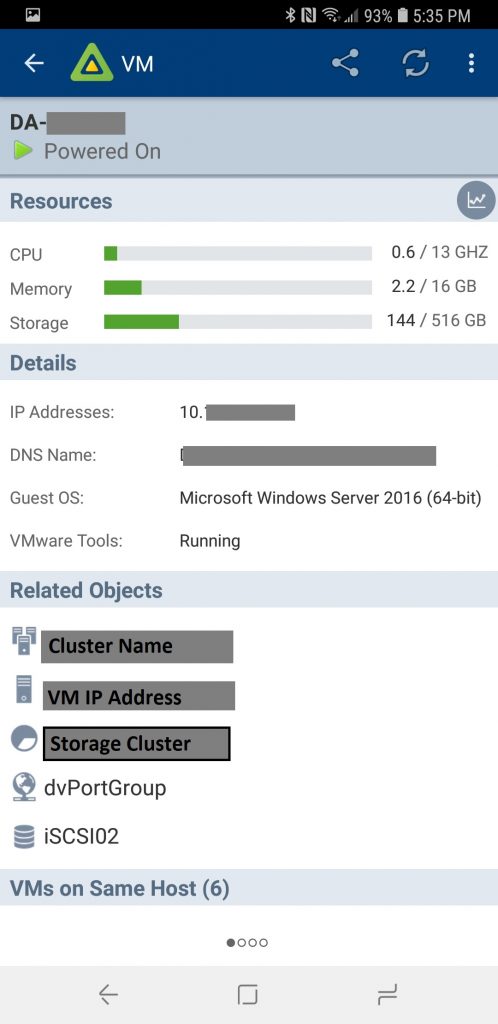
When selecting a VM (Virtual Machine) from the default view, you can view the VM’s Resources (CPU, Memory, and Storage), Details (IP Addresses, DNS hostnames, Guest OS, VMWare Tools Status), related objects, and a list of other VMs running on the same host.
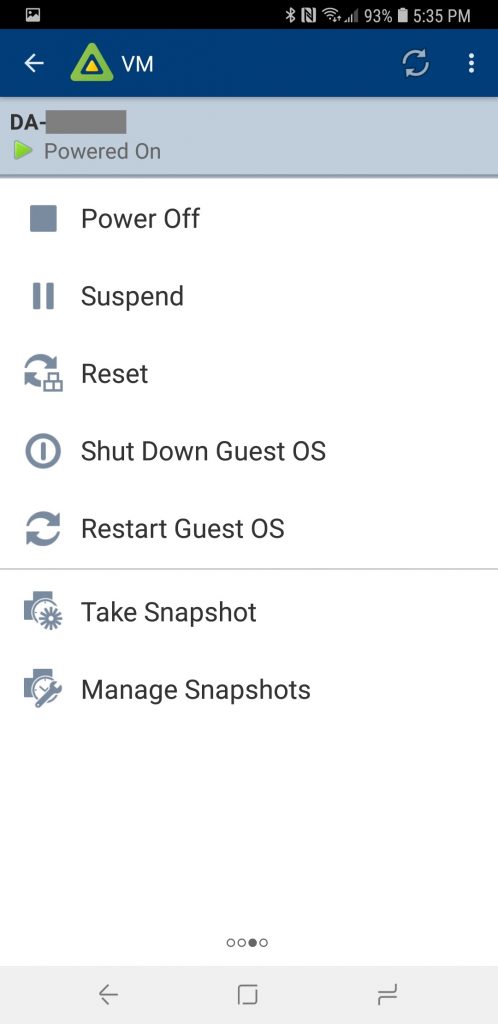
Flipping over to the VM options, we have the ability to power off, suspend, reset, shutdown, or gracefully restart the VM. We also have some snapshot functionality to take a snapshot, or manage VM snapshots.
Additional Notes
In my environment I have two HPE DL360p Gen8 Servers and the sensor data is fully supported (I used the HPE custom ESXi install image which includes host drivers).
