A few months ago, you may have seen my post detailing my experience with ESXi 7.0 on HP Proliant DL360p Gen8 servers. I now have an update as I have successfully loaded ESXi 8.0 on HPE Proliant DL360p Gen8 servers, and want to share my experience.
It wasn’t as eventful as one would have expected, but I wanted to share what’s required, what works, and stability observations.
Please note, this is NOT supported and NOT recommended for production environments. Use the information at your own risk.
A special thank you goes out to William Lam and his post on Homelab considerations for vSphere 8, which provided me with the boot parameter required to allow legacy CPUs.
ESXi on the DL360p Gen8
With the release of vSphere 8.0 Update 1, and all the new features and functionality that come with the vSphere 8 release as a whole, I decided it was time to attempt to update my homelab.
In my setup, I have the following:
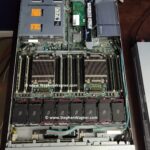
2 x HPE Proliant DL360p Gen8 Servers
Dual Intel Xeon E5-2660v2 Processors in each server
USB and/or SD for booting ESXi
No other internal storage
NVIDIA A2 vGPU (for use with VMware Horizon)
External SAN iSCSI Storage
Since I have 2 servers, I decided to do a fresh install using the generic installer, and then use the HPE addon to install all the HPE addons, drivers, and software. I would perform these steps on one server at a time, continuing to the next if all went well.
I went ahead and documented the configuration of my servers beforehand, and had already had upgraded my VMware vCenter vCSA appliance from 7U3 to 8U1. Note, that you should always upgrade your vCenter Server first, and then your ESXi hosts.
To my surprise the install went very smooth (after enabling legacy CPUs in the installer) on one of the hosts, and after a few days with no stability issues, I then proceeded and upgraded the 2nd host.
I’ve been running with 100% for 25+ days without any issues.
The process – Installing ESXi 8.0
I used the following steps to install VMware vSphere ESXi 8 on my HP Proliant Gen8 Server:
Download the Generic ESXi installer from VMware directly.
Boot server with Generic ESXi installer media (CD or ISO)
IMPORTANT: Press “Shift + o” (Shift key, and letter “o”) to interrupt the ESXi boot loader, and add “AllowLegacyCPU=true” to the kernel boot parameters.
Continue to install ESXi as normal.
You may see warnings about using a legacy CPU, you can ignore these.
Complete initial configuration of ESXi host
Mount NFS or iSCSI datastore.
Copy HPE Custom Addon for ESXi zip file to datastore.
Enable SSH on host (or use console).
Place host in to maintenance mode.
Run “esxcli software vib install -d /vmfs/volumes/datastore-name/folder-name/HPE-801.0.0.11.3.1.1-Jun2023-Addon-depot.zip” from the command line.
The install will run and complete successfully.
Restart your server as needed, you’ll now notice that not only were HPE drivers installed, but also agents like the Agentless management agent, and iLO integrations.
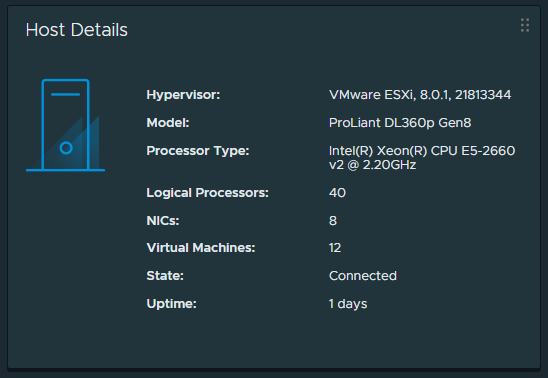
After that, everything was good to go… Here you can see version information from one of the ESXi hosts:
VMware ESXi version 8.0.1 Build 21813344 on HPE Proliant DL360p Gen8 Server
What works, and what doesn’t
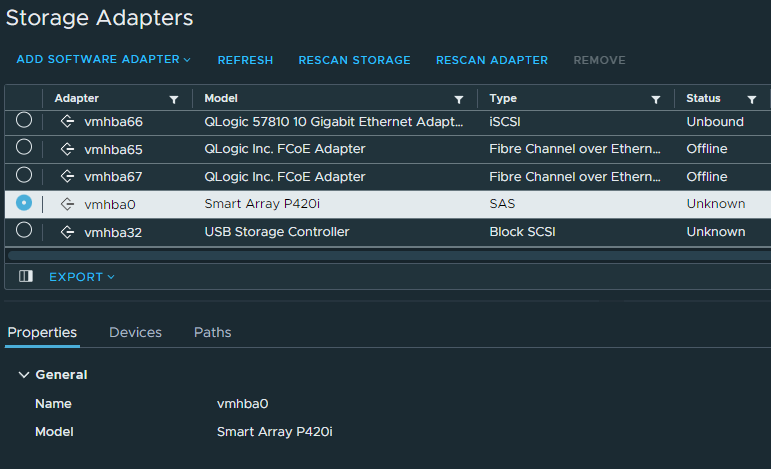
I was surprised to see that everything works, including the P420i embedded RAID controller. Please note that I am not using the RAID controller, so I have not performed extensive testing on it.
HPE P420i RAID Controller with VMware vSphere ESXi 8
All Hardware health information is present, and ESXi is functioning as one would expect if running a supported version on the platform.
Additional Information
Note that with vSphere 8, VMware is deprecating vLCM baselines. Your focus should be to update your ESXi instances using cluster image based update images. You can incorporate vendor add-ons and components to create a customized image for deployment.
With the release of VMware Horizon 2303, VMware Horizon now supports Hybrid Azure AD Join with Azure AD Connect using Instant Clones and non-persistent VDI.
So what exactly does this mean? It means you can now use Azure SSO using PRT (Primary Refresh Token) to authenticate and access on-premise and cloud based applications and resources.
What else? It allows you to use conditional access!
What is Hybrid Azure AD Join, and why would we want to do it with Azure AD Connect?
Historically, it was a bit challenging when it came to Understanding Microsoft Azure AD SSO with VDI (click to read the post and/or see the video), and special considerations had to be made when an organization wished to implement SSO between their on-prem non-persistent VDI deployment and Azure AD.
Hybrid Azure AD Joined Login
Azure AD SSO, the old way
The old way to accomplish this was to either implement Azure AD with ADFS, or use Seamless SSO. ADFS was bulky and annoying to manage, and Seamless SSO was actually intended to enable SSO on “downlevel devices” (older operating systems before Windows 10).
For customers without ADFS, I would always recommend using Seamless SSO to enable SSO on non-persistent VDI Instant Clones, until now!
Azure AD SSO, the new way with Azure AD Connect and Azure SSO PRTs
Hybrid Azure Active Directory for SSO is now supported on instant clone desktop pools. See KB 89127 for details.
This means we can now enable and use Azure SSO with PRTs (Primary Refresh Tokens) using Azure AD Connect and non-persistent VDI Instant Clones.
Azure SSO with PRT and Non-Persistent VDI
This is actually a huge deal because not only does it allow us to use the preferred method for performing SSO with Azure, but it also allows us to start using fancy Azure features like conditional access!
Requirements for Hybrid Azure AD Join with non-persistent VDI and Azure AD Connect
In order to utilize Hybrid Join and PRTs with non-persistent VDI on Horizon, you’ll need the following:
VMware Horizon 2303 (or later)
Active Directory
Azure AD Connect (Implemented, Configured, and Functioning)
Azure AD Hybrid Domain Join must be enabled
OU and Object filtering must include the non-persistent computer objects and computer accounts
Create a VMware Horizon Non-Persistent Desktop Pool for Instant Clones
“Allow Reuse of Existing Computer Accounts” must be checked
When you configure this, you’ll notice that after provisioning a desktop pool (or pushing a new snapshot), that there may be a delay for PRTs to be issued. This is expected, however the PRT will be issued eventually, and subsequent desktops shouldn’t experience issues unless you have a limited number available.
*Please note: VMware still notes that ADFS is the preferred way for fast issuance of the PRT.
While VMware does recommend ADFS for performance when issuing PRTs, in my own testing I had no problems or complaints, however when deploying this in production I’d recommend that because of the PRT delay after deploying the pool or a new snapshot, to do this after hours or SSO will not function for some users who immediately get a new desktop.
Additional Considerations
Please note the following:
When switching from ADFS to Azure AD Connect, the sign-in process may change for users.
You must prepare the users for the change.
When using locally stored identifies and/or cached credentials, enabling Azure SSO may change the login process, or cause issues for users signing in.
You may have to delete saved credentials in the users persistent profile
You may have to adjust GPOs to account for Azure SSO
You may have to modify settings in your profile persistent solution
Example: “RoamIdentity” on FSLogix
I recommend testing before implementing
Test Environment
Test with new/blank user profiles
Test with existing users
If you’re coming from an environment that was previously using Seamless SSO for non-persistent VDI, you can create new test desktop pools that use newly created Active Directory OU containers and adjust the OU filtering appropriately to include the test OUs for synchronization to Azure AD with Azure AD Connect. This way you’re only syncing the test desktop pool, while allowing Seamless SSO to continue to function for existing desktop pools.
How to test Azure AD Hybrid Join, SSO, and PRT
To test the current status of Azure AD Hybrid Join, SSO, and PRT, you can use the following command:
dsregcmd /status
To check if the OS is Hybrid Domain joined, you’ll see the following:
+----------------------------------------------------------------------+
| Device State                                                         |
+----------------------------------------------------------------------+

             AzureAdJoined : YES
          EnterpriseJoined : NO
              DomainJoined : YES
                DomainName : DOMAIN
As you can see above, “AzureADJoined” is “YES”.
Further down the output, you’ll find information related to SSO and PRT Status:
+----------------------------------------------------------------------+
| SSO State                                                            |
+----------------------------------------------------------------------+

                AzureAdPrt : YES
      AzureAdPrtUpdateTime : 2023-07-23 19:46:19.000 UTC
      AzureAdPrtExpiryTime : 2023-08-06 19:46:18.000 UTC
       AzureAdPrtAuthority : https://login.microsoftonline.com/XXXXXXXX-XXXX-XXXXXXX
             EnterprisePrt : NO
    EnterprisePrtAuthority :
                 OnPremTgt : NO
                  CloudTgt : YES
         KerbTopLevelNames : XXXXXXXXXXXXX
Here we can see that “AzureAdPrt” is YES which means we have a valid Primary Refresh Token issued by Azure AD SSO because of the Hybrid Join.
You might ask if/what the procedure is for updating Enhanced Linked Mode vCenter Server Instances, or is there even any considerations that apply?
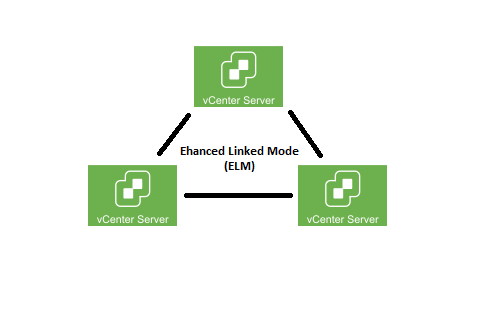
vCenter Enhanced Link Mode is a feature that allows you to link a total of 15 vCenter Instances in to a single, Single Sign On (SSO) vSphere domain. This allows you to have a single set of credentials to manage all 15 instances, as well as the ability to manage all of them from a single pane of glass.
When it comes to environments with multiple vCenter instance and/or vCSA appliances, this really helps manageability, and visibility.
Enhanced Linked Mode Upgrade Considerations
To answer the question above: Yes, when you’re running Enhanced Linked Mode (ELM) to link multiple vCenter Server, special considerations and requirements exist when it comes to updating or upgrading your vCenter Server instances and vCSA appliances.
Multiple VMware vCenter Server Instances (vCSA) Running in Enhanced Link Mode (ELM)
Not only have these procedures been documented in older VMware documentation, but I recently reviewed and confirmed the best practices with VMware GSS while on a support case.
Procedure for updating vCenter with ELM
Configure/Confirm that the vCenter File-Based Backup in VAMI is configured, functioning, and that you are creating valid file based backups.
Create a manual file-based backup with VAMI
Power down all vCenter Instances and vCSA Appliances in your environment
Perform a cold snapshot of all vCenter Instances and vCSA appliances
*This is critical* – You need a valid offline snapshot taken of all appliances powered off at the same point in time
Power on the vCenter/vCSA Virtual Machines (VMs)
Perform the update or upgrade
Recovering from a failed Update
IMPORTANT: In the event that an update or upgrade fails, you must revert all vCenter Instances and/or vCSA appliances back to the previous snapshot!
You cannot selectively choose single or individual instances, as this may cause mismatches in data and configuration between the instances as they have databases that are not in sync, and are from different points in time.
Additionally, if you are in a situation where you’re considering or planning to restore previous snapshots to recover from a failed update, you should do so sooner than later. As time progresses, service accounts and identifiers update in the VMware vSphere infrastructure. Delaying the restore too long could cause this information to get out of sync with the ESXi hosts after performing a snapshot restore/revert.
In this NVIDIA vGPU Troubleshooting Guide, I’ll help show you how to troubleshoot NVIDIA vGPU issues on VMware platforms, including VMware Horizon and VMware Tanzu. This guide applies to the full vGPU platform, so it’s relevant for VDI, AI, ML, and Kubernetes workloads, as well other virtualization platforms.
This guide will provide common troubleshooting methods, along with common issues and problems associated with NVIDIA vGPU as well as their fixes.
Please note, there are numerous other additional methods available to troubleshoot your NVIDIA vGPU deployment, including 3rd party tools. This is a general document provided as a means to get started learning how to troubleshoot vGPU.
NVIDIA vGPU
NVIDIA vGPU is a technology platform that includes a product line of GPUs that provide virtualized GPUs (vGPU) for Virtualization environments. Using a vGPU, you can essentially “slice” up a physical GPU and distribute Virtual GPUs to a number of Virtual Machines and/or Kubernetes containers.
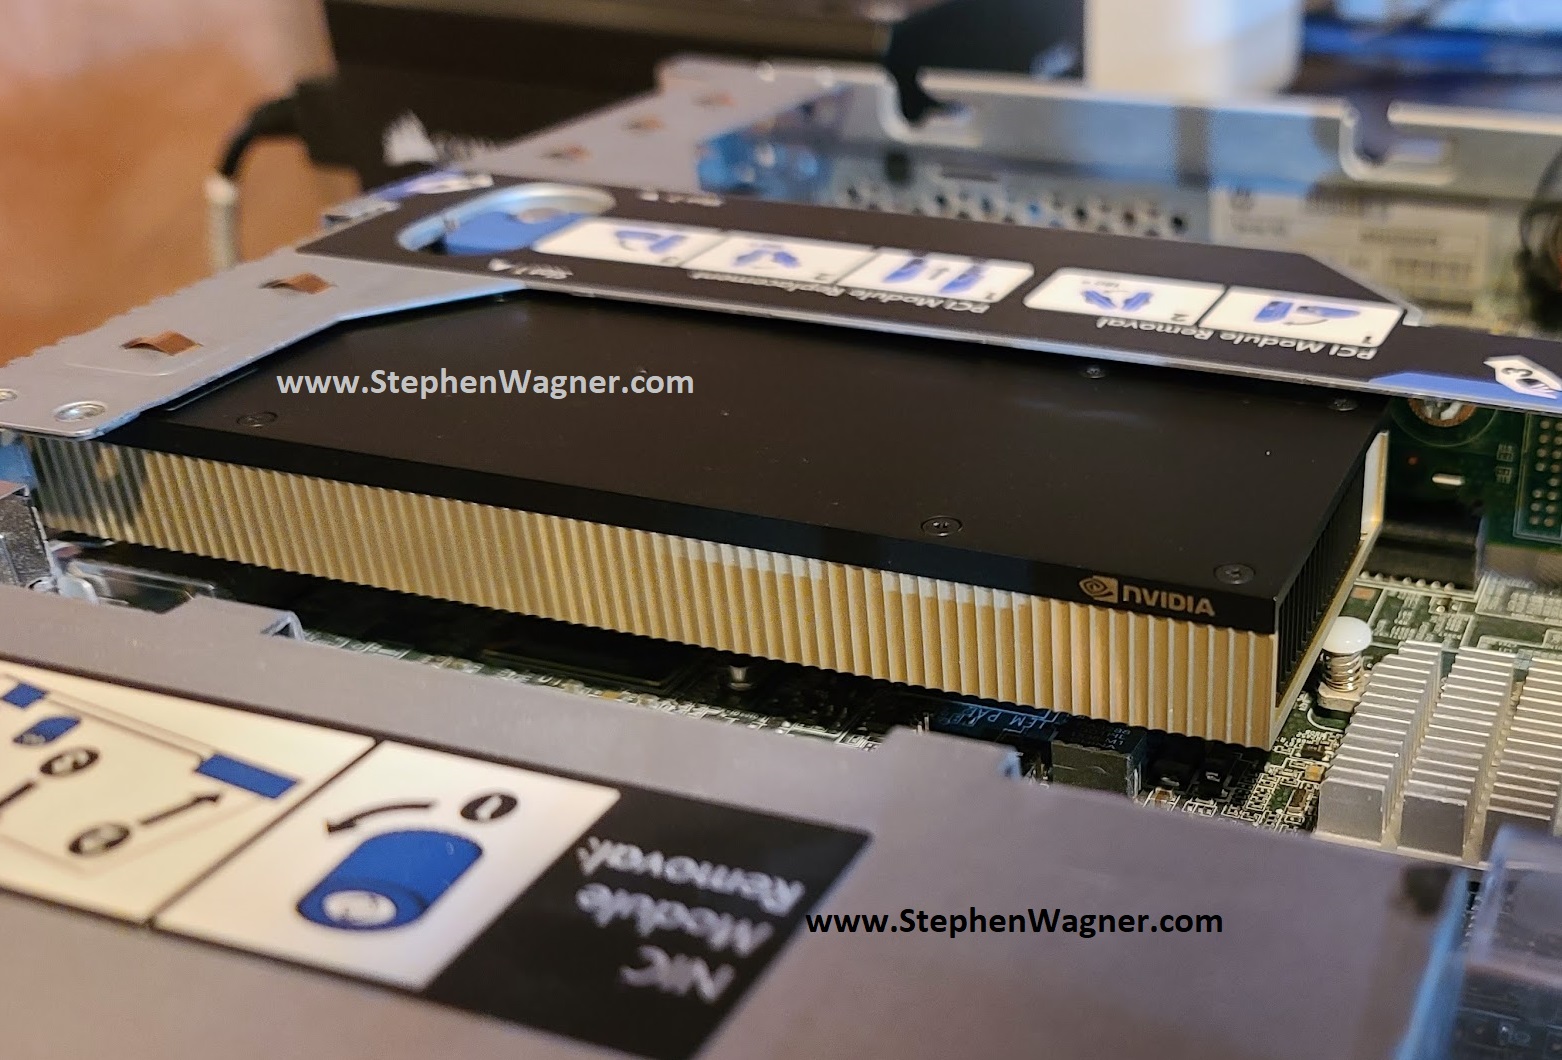
NVIDIA vGPU Installed in VMware ESXi Host
These virtual machines and containers can then use these vGPU’s to provide accelerated workloads including VDI (Virtual Desktop Infrastructure), AI (Artificial Intelligence), and ML (Machine Learning).
While the solution works beautifully, when deployed incorrectly or if the solution isn’t maintained, issues can occur requiring troubleshooting and remediation.
The NVIDIA vGPU driver comes with a utility called the “NVIDIA System Management Interface”. This CLI program allows you to monitor, manage, and query your NVIDIA vGPU (including non-vGPU GPUs).
NVIDIA vGPU “nvidia-smi” command
Simply running the command with no switches or flags, allow you to query and pull basic information on your vGPU, or multiple vGPUs.
For a list of available switches, you can run: “nvidia-smi -h”.
Running “nvidia-smi” on the ESXi Host
To use “nvidia-smi” on your VMware ESXi host, you’ll need to SSH in and/or enable console access.
When you launch “nvidia-smi” on the ESXi host, you’ll see information on the physical GPU, as well as the VM instances that are consuming a virtual GPU (vGPU). This usage will also provide information like fan speeds, temperatures, power usage and GPU utilization.
[root@ESXi-Host:~] nvidia-smi
Sat Mar  4 21:26:05 2023
+-----------------------------------------------------------------------------+
| NVIDIA-SMI 525.85.07    Driver Version: 525.85.07    CUDA Version: N/A      |
|-------------------------------+----------------------+----------------------+
| GPU  Name        Persistence-M| Bus-Id        Disp.A | Volatile Uncorr. ECC |
| Fan  Temp  Perf  Pwr:Usage/Cap|         Memory-Usage | GPU-Util  Compute M. |
|                               |                      |               MIG M. |
|===============================+======================+======================|
|   0  NVIDIA A2           On   | 00000000:04:00.0 Off |                  Off |
|  0%   36C    P8     8W /  60W |   7808MiB / 16380MiB |      0%      Default |
|                               |                      |                  N/A |
+-------------------------------+----------------------+----------------------+

+-----------------------------------------------------------------------------+
| Processes:                                                                  |
|  GPU   GI   CI        PID   Type   Process name                  GPU Memory |
|        ID   ID                                                   Usage      |
|=============================================================================|
|    0   N/A  N/A   2108966    C+G   VM-WS02                          3904MiB |
|    0   N/A  N/A   2108989    C+G   VM-WS01                          3904MiB |
+-----------------------------------------------------------------------------+
This will aid with troubleshooting potential issues specific to the host or the VM. The following pieces of information are helpful:
Driver Version
GPU Fan and Temperature Information
Power Usage
GPU Utilization (GPU-Util)
ECC Information and Error Count
Virtual Machine VMs assigned a vGPU
vGPU Type (C+G means Compute and Graphics)
Additionally, instead of running once, you can issue “nvidia-smi -l x” replacing “x” with the number of seconds you’d like it to auto-loop and refresh.
Example:
nvidia-smi -l 3
The above would refresh and loop “nvidia-smi” every 3 seconds.
For vGPU specific information from the ESXi host, you can run:
nvidia-smi vgpu
root@ESXi-Host:~] nvidia-smi vgpu
Mon Mar  6 11:47:44 2023
+-----------------------------------------------------------------------------+
| NVIDIA-SMI 525.85.07              Driver Version: 525.85.07                 |
|---------------------------------+------------------------------+------------+
| GPU  Name                       | Bus-Id                       | GPU-Util   |
|      vGPU ID     Name           | VM ID     VM Name            | vGPU-Util  |
|=================================+==============================+============|
|   0  NVIDIA A2                  | 00000000:04:00.0             |   0%       |
|      3251713382  NVIDIA A2-4Q   | 2321577  VMWS01              |      0%    |
+---------------------------------+------------------------------+------------+
This command shows information on the vGPU instances currently provisioned.
There are also a number of switches you can throw at this to get even more information on vGPU including scheduling, vGPU types, accounting, and more. Run the following command to view the switches:
nvidia-smi vgpu -h
Another common switch I use on the ESXi host with vGPU for troubleshooting is: “nvidia-smi -q”, which provides lots of information on the physical GPU in the host:
[root@ESXi-HOST:~] nvidia-smi -q

==============NVSMI LOG==============

Timestamp                                 : Sat Mar  4 21:26:18 2023
Driver Version                            : 525.85.07
CUDA Version                              : Not Found
vGPU Driver Capability
        Heterogenous Multi-vGPU           : Supported

Attached GPUs                             : 1
GPU 00000000:04:00.0
    Product Name                          : NVIDIA A2
    Product Brand                         : NVIDIA
    Product Architecture                  : Ampere
    Display Mode                          : Enabled
    Display Active                        : Disabled
    Persistence Mode                      : Enabled
    vGPU Device Capability
        Fractional Multi-vGPU             : Not Supported
        Heterogeneous Time-Slice Profiles : Supported
        Heterogeneous Time-Slice Sizes    : Not Supported
    MIG Mode
        Current                           : N/A
        Pending                           : N/A
    Accounting Mode                       : Enabled
    Accounting Mode Buffer Size           : 4000
    Driver Model
        Current                           : N/A
        Pending                           : N/A
    Serial Number                         : XXXN0TY0SERIALZXXX
    GPU UUID                              : GPU-de23234-3450-6456-e12d-bfekgje82743a
    Minor Number                          : 0
    VBIOS Version                         : 94.07.5B.00.92
    MultiGPU Board                        : No
    Board ID                              : 0x400
    Board Part Number                     : XXX-XXXXX-XXXX-XXX
    GPU Part Number                       : XXXX-XXX-XX
    Module ID                             : 1
    Inforom Version
        Image Version                     : G179.0220.00.01
        OEM Object                        : 2.0
        ECC Object                        : 6.16
        Power Management Object           : N/A
    GPU Operation Mode
        Current                           : N/A
        Pending                           : N/A
    GSP Firmware Version                  : N/A
    GPU Virtualization Mode
        Virtualization Mode               : Host VGPU
        Host VGPU Mode                    : SR-IOV
    IBMNPU
        Relaxed Ordering Mode             : N/A
    PCI
        Bus                               : 0x04
        Device                            : 0x00
        Domain                            : 0x0000
        Device Id                         : 0x25B610DE
        Bus Id                            : 00000000:04:00.0
        Sub System Id                     : 0x157E10DE
        GPU Link Info
            PCIe Generation
                Max                       : 3
                Current                   : 1
                Device Current            : 1
                Device Max                : 4
                Host Max                  : N/A
            Link Width
                Max                       : 16x
                Current                   : 8x
        Bridge Chip
            Type                          : N/A
            Firmware                      : N/A
        Replays Since Reset               : 0
        Replay Number Rollovers           : 0
        Tx Throughput                     : 0 KB/s
        Rx Throughput                     : 0 KB/s
        Atomic Caps Inbound               : N/A
        Atomic Caps Outbound              : N/A
    Fan Speed                             : 0 %
    Performance State                     : P8
    Clocks Throttle Reasons
        Idle                              : Active
        Applications Clocks Setting       : Not Active
        SW Power Cap                      : Not Active
        HW Slowdown                       : Not Active
            HW Thermal Slowdown           : Not Active
            HW Power Brake Slowdown       : Not Active
        Sync Boost                        : Not Active
        SW Thermal Slowdown               : Not Active
        Display Clock Setting             : Not Active
    FB Memory Usage
        Total                             : 16380 MiB
        Reserved                          : 264 MiB
        Used                              : 7808 MiB
        Free                              : 8306 MiB
    BAR1 Memory Usage
        Total                             : 16384 MiB
        Used                              : 1 MiB
        Free                              : 16383 MiB
    Compute Mode                          : Default
    Utilization
        Gpu                               : 0 %
        Memory                            : 0 %
        Encoder                           : 0 %
        Decoder                           : 0 %
    Encoder Stats
        Active Sessions                   : 0
        Average FPS                       : 0
        Average Latency                   : 0
    FBC Stats
        Active Sessions                   : 0
        Average FPS                       : 0
        Average Latency                   : 0
    Ecc Mode
        Current                           : Disabled
        Pending                           : Disabled
    ECC Errors
        Volatile
            SRAM Correctable              : N/A
            SRAM Uncorrectable            : N/A
            DRAM Correctable              : N/A
            DRAM Uncorrectable            : N/A
        Aggregate
            SRAM Correctable              : N/A
            SRAM Uncorrectable            : N/A
            DRAM Correctable              : N/A
            DRAM Uncorrectable            : N/A
    Retired Pages
        Single Bit ECC                    : N/A
        Double Bit ECC                    : N/A
        Pending Page Blacklist            : N/A
    Remapped Rows
        Correctable Error                 : 0
        Uncorrectable Error               : 0
        Pending                           : No
        Remapping Failure Occurred        : No
        Bank Remap Availability Histogram
            Max                           : 64 bank(s)
            High                          : 0 bank(s)
            Partial                       : 0 bank(s)
            Low                           : 0 bank(s)
            None                          : 0 bank(s)
    Temperature
        GPU Current Temp                  : 37 C
        GPU T.Limit Temp                  : N/A
        GPU Shutdown Temp                 : 96 C
        GPU Slowdown Temp                 : 93 C
        GPU Max Operating Temp            : 86 C
        GPU Target Temperature            : N/A
        Memory Current Temp               : N/A
        Memory Max Operating Temp         : N/A
    Power Readings
        Power Management                  : Supported
        Power Draw                        : 8.82 W
        Power Limit                       : 60.00 W
        Default Power Limit               : 60.00 W
        Enforced Power Limit              : 60.00 W
        Min Power Limit                   : 35.00 W
        Max Power Limit                   : 60.00 W
    Clocks
        Graphics                          : 210 MHz
        SM                                : 210 MHz
        Memory                            : 405 MHz
        Video                             : 795 MHz
    Applications Clocks
        Graphics                          : 1770 MHz
        Memory                            : 6251 MHz
    Default Applications Clocks
        Graphics                          : 1770 MHz
        Memory                            : 6251 MHz
    Deferred Clocks
        Memory                            : N/A
    Max Clocks
        Graphics                          : 1770 MHz
        SM                                : 1770 MHz
        Memory                            : 6251 MHz
        Video                             : 1650 MHz
    Max Customer Boost Clocks
        Graphics                          : 1770 MHz
    Clock Policy
        Auto Boost                        : N/A
        Auto Boost Default                : N/A
    Voltage
        Graphics                          : 650.000 mV
    Fabric
        State                             : N/A
        Status                            : N/A
    Processes
        GPU instance ID                   : N/A
        Compute instance ID               : N/A
        Process ID                        : 2108966
            Type                          : C+G
            Name                          : VM-WS02
            Used GPU Memory               : 3904 MiB
        GPU instance ID                   : N/A
        Compute instance ID               : N/A
        Process ID                        : 2108989
            Type                          : C+G
            Name                          : VM-WS01
            Used GPU Memory               : 3904 MiB
As you can see, you can pull quite a bit of information in detail from the vGPU, as well as the VM processes.
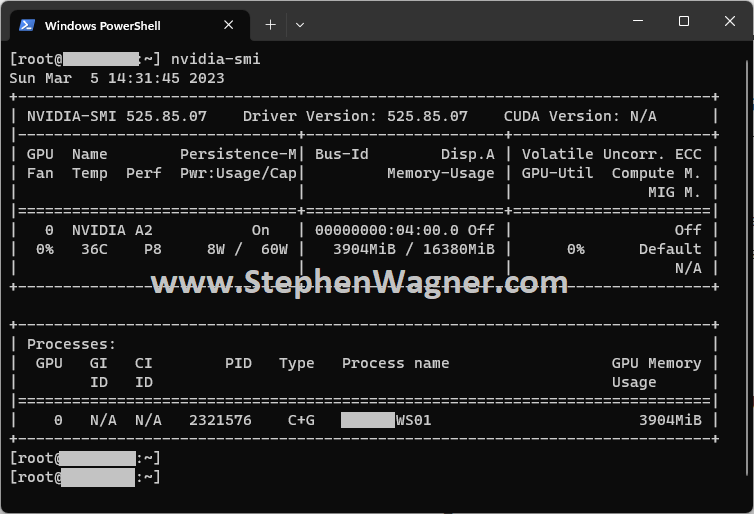
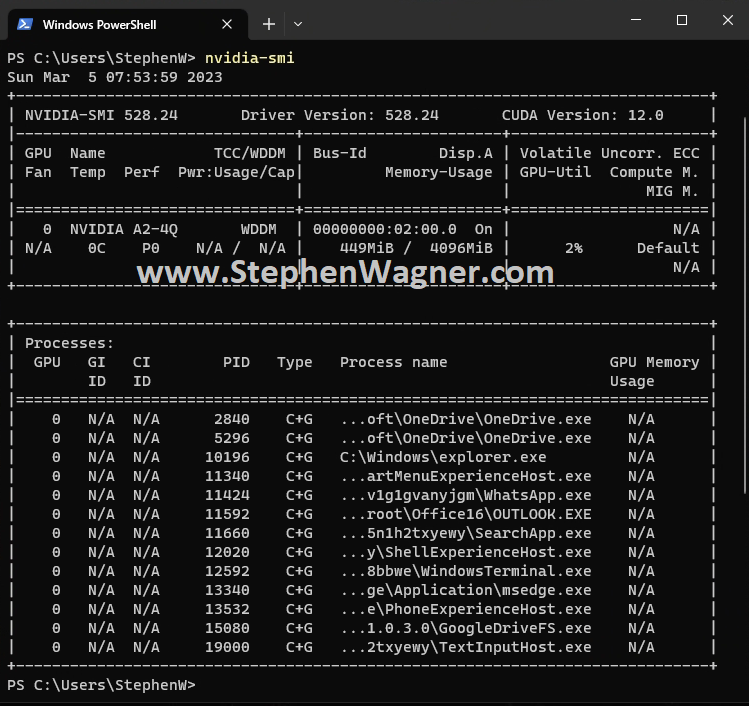
Running “nvidia-smi” on the VM Guest
You can also run “nvidia-smi” inside of the guest VM, which will provide you information on the vGPU instance that is being provided to that specific VM, along with information on the guest VM’s processes that are utilizing the GPU.
“nvidia-smi” Running on Guest VM
This is helpful for providing information on the guest VM’s usage of the vGPU instance, as well as processes that require GPU usage.
Virtual Machine log files
Each Virtual Machine has a “vmware.log” file inside of the VM’s folder on the datastore.
To identify logging events pertaining to NVIDIA vGPU, you can search for the “vmiop” string inside of the vmware.log file.
The above will read out any lines inside of the log that have the “vmiop” string inside of them. The “-i” flag instructs grep to ignore case sensitivity.
This logs provide initialization information, licensing information, as well as XID error codes and faults.
ESXi Host log files
Additionally, since the ESXi host is running the vGPU Host Driver (vGPU Manager), it also has logs that pertain and assist with vGPU troubleshooting.
Some commands you can run are:
cat /var/log/vmkernel.log | grep -i vmiop
cat /var/log/vmkernel.log | grep -i nvrm
cat /var/log/vmkernel.log | grep -i nvidia
The above commands will pull NVIDIA vGPU related log items from the ESXi log files.
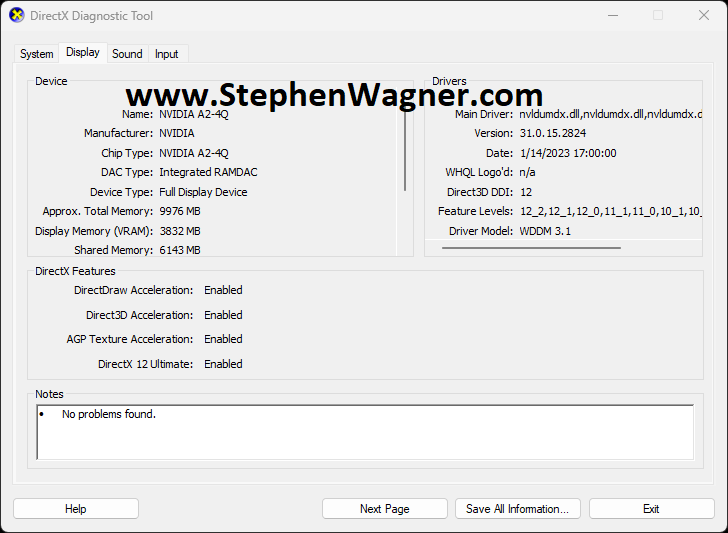
Using “dxdiag” in the guest VM
Microsoft has a tool called “dxdiag” which provides diagnostic infromation for testing and troubleshooting video (and sound) with DirectX.
I find this tool very handy for quickly verifying
NVIDIA vGPU with Microsoft DirectX “dxdiag” tool
As you can see:
DirectDraw Acceleration: Enabled
Direct3D Acceleration: Enabled
AGP Texture Acceleration: Enabled
DirectX 12 Ultimate: Enabled
The above show that hardware acceleration is fully functioning with DirectX. This is a indicator that things are generally working as expected. If you have a vGPU and one of the first three is showing as disabled, then you have a problem that requires troubleshooting. Additionally, if you do not see your vGPU card, then you have a problem that requires troubleshooting.
Please Note: You may not see “DirectX 12 Ultimate” as this is related to licensing.
Using the “VMware Horizon Performance Monitor”
The VMware Horizon Performance Monitor, is a great tool that can be installed by the VMware Horizon Agent, that allows you to pull information (stats, connection information, etc) for the session. Please note that this is not installed by default, and must be selected when running the Horizon Agent installer.
When it comes to troubleshooting vGPU, it’s handy to use this too to confirm you’re getting H.264 or H.265/HEVC offload from the vGPU instance, and also get information on how many FPS (Frames Per Second) you’re getting from the session.
VMware Horizon Performance Tracker with NVIDIA vGPU
Once opening, you’ll change the view above using the specified selector, and you can see what the “Encoder Name” is being used to encode the session.
Examples of GPU Offload “Encoder Name” types:
NVIDIA NvEnc HEVC 4:2:0 – This is using the vGPU offload using HEVC
NVIDIA NvEnc HEVC 4:4:4 – This is using the vGPU offload using HEVC high color accuracy
NVIDIA NvEnc H264 4:2:0 – This is using the vGPU offload using H.264
NVIDIA NvEnc H264 4:4:4 – This is using the vGPU offload using H.264 high color accuracy
Examples of Software (CPU) Session “Encoder Name” types:
BlastCodec – New VMware Horizon “Blast Codec”
h264 4:2:0 – Software CPU encoded h.264
If you’re seeing “NVIDIA NvEnc” in the encoder name, then the encoding is being offloaded to the GPU resulting in optimum performance. If you don’t see it, it’s most likely using the CPU for encoding, which is not optimal if you have a vGPU, and requires further troubleshooting.
NVIDIA vGPU Known Issues
Depending on the version of vGPU that you are running, there can be “known issues”.
When viewing the NVIDIA vGPU Documentation, you can view known issues, and fixes that NVIDIA may provide. Please make sure to reference the documentation specific to the version you’re running and/or the version that fixes the issues you’re experiencing.
vGPU Common Problems
There are a number of common problems that I come across when I’m contacted to assist with vGPU deployments.
Please see below for some of the most common issues I experience, along with their applicable fix/workaround.
XID Error Codes
When viewing your Virtual Machine VM or ESXi log file, and experiencing an XID error or XID fault, you can usually look up the error codes.
The table on this page allows you to lookup the XID code, find the cause, and also provides information if the issue is realted to “HW Error” (Hardware Error), “Driver Error”, “User App Error”, “System Memory Corruption”, “Bus Error”, “Thermal Issue”, or “FB Corruption”.
One can see XID code 45, as well as XID code 43, which after looking up on NVIDIA’s document, states:
XID 43 – GPU stopped processing
Possible Cause: Driver Error
Possible Cause: User App Error
XID 45 – Preemptive cleanup, due to previous errors — Most likely to see when running multiple cuda applications and hitting a DBE
Possible Cause: Driver Error
In the situation above, one can deduce that the issue is either Driver Error, Application Error, or a combination of both. In this specific case, you could try changing drivers to troubleshoot.
vGPU Licensing
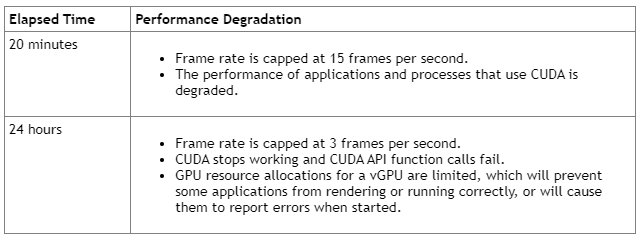
You may experience issues in your vGPU deployment due to licensing issues. Depending on how you have you environment configured, you may be running in an unlicensed mode and not be aware.
In the event that the vGPU driver cannot obtain a valid license, it will run for 20 minutes with full capabilities. After that the performance and functionality will start to degrade. After 24 hours it will degrade even further.
Some symptoms of issues experienced when unlicensed:
Users experiencing laggy VDI sessions
Performance issues
Frames per Second (FPS) limited to 15 fps or 3 fps
Applications using OpenCL, CUDA, or other accelerated APIs fail
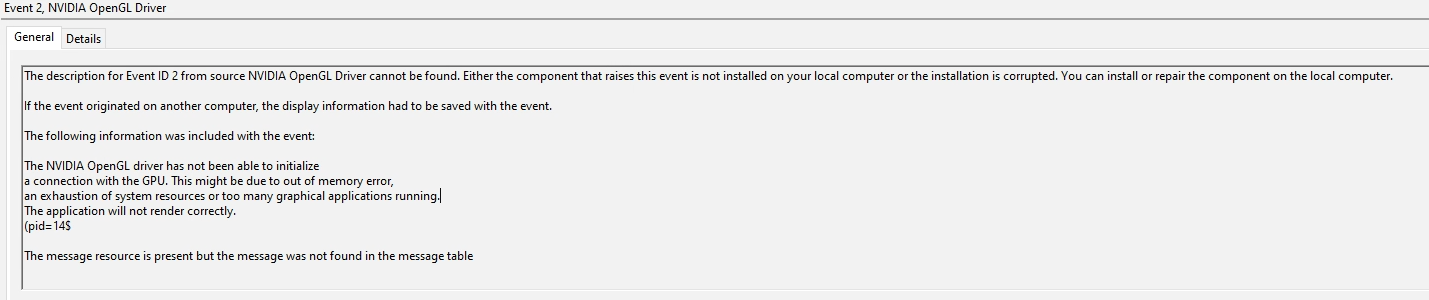
Additionally, some error messages and event logs may occur:
Event ID 2, “NVIDIA OpenGL Driver” – “The NVIDIA OpenGL driver has not been able to initialize a connection with the GPU.”
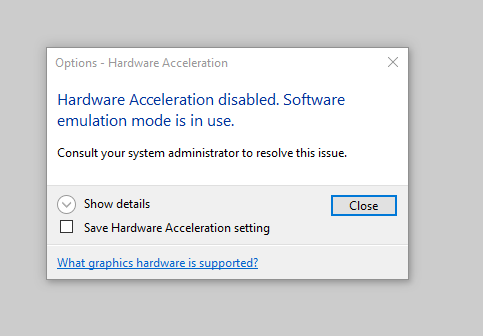
AutoCAD/Revit – “Hardware Acceleration is disabled. Software emulation mode is in use.”
“Guest is unlicensed”
Please see below for screenshots of said errors:
vGPU Guest Is UnlicensedNVIDIA OpenGL Driver Not FoundAutoCAD Hardware Acceleration Disabled
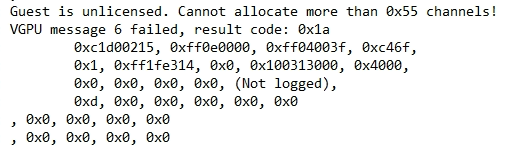
Additonally, when looking at the Virtual Machine VM vmware.log (inside of the VM’s folder on the ESXi datastore), you may see:
Guest is unlicensed. Cannot allocate more than 0x55 channels!
VGPU message 6 failed, result code: 0x1a
If this occurs, you’ll need to troubleshoot your vGPU licensing and resolve any issues occurring.
vGPU Type (vGPU Profile) mismatch
When using the default (“time-sliced”) vGPU deployment method, only a single vGPU type can be used on virtual machines or containers per physical GPU. Essentially all VMs or containers utilizing the physical GPU must use the same vGPU type.
If the physical GPU card has multiple GPUs (GPU chips), then a different type can be used on each physical GPU chip on the same card. 2 x GPUs on a single card = 2 different vGPU types.
Additionally, if you have multiple cards inside of a single host, the number of vGPU types you can deployed is based off the total number of GPUs across the total number of cards in your host.
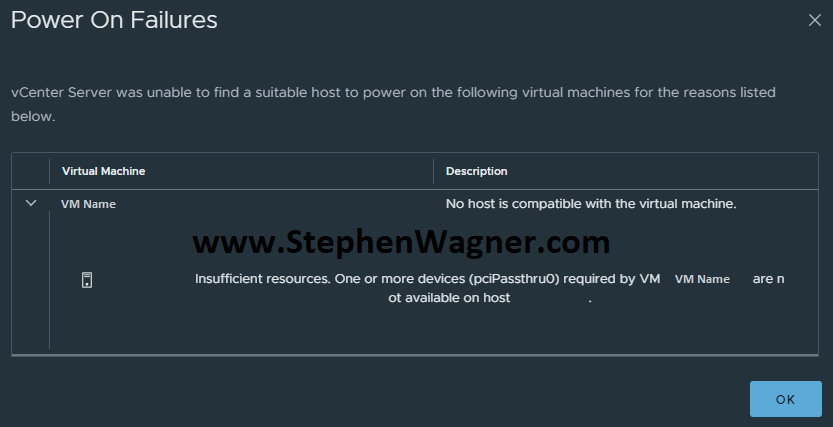
If you configure multiple vGPU types and cannot support it, you will have issues starting VMs, as shown below:
Cannot power on VM with vGPU: Power on Failure, Insuffiecient resources
The error reads as follows:
Power On Failures

vCenter Server was unable to find a suitable host to power on the following virtual machines for the reasons listed below.

Insufficient resources. One or more devices (pciPassthru0) required by VM VDIWS01 are not available on host ESXi-Host.
Additionally, if provisioning via VMware Horizon, you may see: “NVIDIA GRID vGPU Support has detected a mismatch with the supported vGPUs”
Note: If you are using MIG (Multi Instance GPU), this does not apply as different MIG types can be applied to VMs from the same card/GPU.
vGPU or Passthrough with 16GB+ of Video RAM Memory
When attaching a vGPU to a VM, or passing through a GPU to a VM, with 16GB or more of Video RAM (Framebuffer memory), you may run in to a situation where the VM will not boot.
This is because the VM cannot map that large of memory space to be accesible for use.
Your users may report issues where their VDI guest VM freezes for a period of time during use. This could be caused due to VMware vMotion moving the virtual machine from one VMware ESXi host to another.
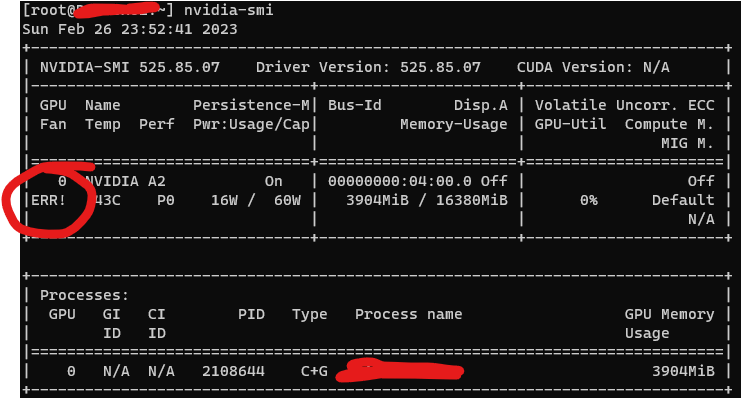
When experiencing issues, you may notice that “nvidia-smi” throws “ERR!” in the view. See the example below:
NVIDIA vGPU “nvidia-smi” reporting “ERR!”
This is an indicator that you’re in a fault or error state, and would recommend checking the ESXi Host log files, and the Virtual Machine log files for XID codes to identify the problem.
vGPU Driver Mismatch
When vGPU is deployed, drivers are installed on the VMware ESXi host (vGPU Manager Driver), as well as the guest VM virtual machine (guest VM driver).
NVIDIA vGPU Driver Mismatch
These two drivers must be compatible with each other. As per NVIDIA’s Documentation, see below for compatibility:
NVIDIA vGPU Manager with guest VM drivers from the same release
NVIDIA vGPU Manager with guest VM drivers from different releases within the same major release branch
NVIDIA vGPU Manager from a later major release branch with guest VM drivers from the previous branch
Additionally, if you’re using the LTS (Long Term Support Branch), the additional compatibility note applies.
NVIDIA vGPU Manager from a later long-term support branch with guest VM drivers from the previous long-term support branch
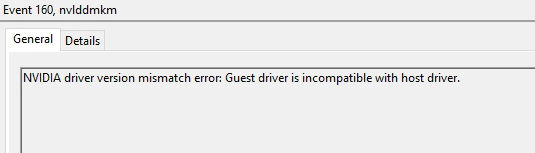
If you have a vGPU driver mismatch, you’ll likely see Event ID 160 from “nvlddmkm” reporting:
NVIDIA driver version mismatch error: Guest driver is incompatible with host drive.
To resolve this, you’ll need to change drivers on the ESXi host and/or Guest VM to a supported combination.
Upgrading NVIDIA vGPU
When upgrading NVIDIA vGPU drivers on the host, you may experience issues or errors stating that the NVIDIA vGPU modules or services are loaded and in use, stopping your ability to upgrade.
Normally an upgrade would be preformed by placing the host in maintenance mode and running:
However, this fails due to modules that are loaded and in use by the NVIDIA vGPU Manager Services.
Before attempting to upgrade (or uninstall and re-install), place the host in maintenance mode and run the following command:
/etc/init.d/nvdGpuMgmtDaemon stop
This should allow you to proceed with the upgrade and/or re-install.
VMware Horizon Black Screen
If you experiencing a blank or black screen when connecting to a VDI session with an NVIDIA vGPU on VMware Horizon, it may not even be related to the vGPU deployment.
To troubleshoot the VMware Horizon Black Screen, please review my guide on how to troubleshoot a VMware Horizon Blank Screen.
VM High CPU RDY (High CPU Ready)
CPU RDY (CPU Ready) is a state when a VM is ready and waiting to be scheduled on a physical host’s CPU. In more detail, the VM’s vCPUs are ready to be scheduled on the ESXi host’s pCPUs.
In rare cases, I have observed situations where VMs with a vGPU and high CPU RDY times, experience instability. I believe this is due to timing conflicts with the vGPU’s time slicing, and the VM’s CPU waiting to be scheduled.
To check VM CPU RDY, you can use one of the following methods:
Run “esxtop” from the CLI using the console or SSH
View the hosts performance stats on vCenter
Select host, “Monitor”, “Advanced”, “Chart Options”, de-select all, select “Readiness Average %”
When viewing the CPU RDY time in a VDI environment, generally we’d like to see CPU RDY at 3 or lower. Anything higher than 3 may cause latency or user experience issues, or even vGPU issues at higher values.
For your server virtualization environment (non-VDI and no vGPU), CPU Ready times are not as big of a consideration.
vGPU Profiles Missing from VMware Horizon
When using newer GPUs with older versions of VMware Horizon, you may encounter an issue with non-persistent instant clones resulting in a provisioning error.
This is caused by missing vGPU Types or vGPU Profiles, and requires either downloading the latest definitions, or possibly creating your own.
Issues with the VMware Horizon Indirect Display Driver
You may experience vGPU (and GPU) related issues when using certain applications due to the presence of the VMware Horizon Indirect Display Driver in the Virtual Machine. This is due to the application either querying the incorrect Display Adapter (VMware Indirect Display Driver), or due to lack of multi-display adapter support in the application.
The application, when detecting vGPU and/or GPU capabilities, may query the Indirect Display Adapter, instead of the vGPU in the VM. Resulting in failing to detect the vGPU and/or GPU capabilities.
To workaround this issue, uninstall the VMware Horizon Indirect Display Adapter from the Device Manager in the VM. Please note that if you simply disable it, the issue will still occur as the device must be uninstalled from the Device Manager.
Additionally, under normal circumstances you do not want to modify, change, or remove this display adapter. However this is only a workaround if you are experiencing this issue. Subsequent updates of the VMware Horizon agent will re-install this adapter.
When using VMware vSphere, you may notice vCenter OVF Import and Datastore File Access Issues, when performing various tasks with OVF Imports, as well as uploading and/or downloading files from datastores.
These issues can cause a number of symptoms including errors, unexpected status codes, and also just simply failing for an undetermined reason.
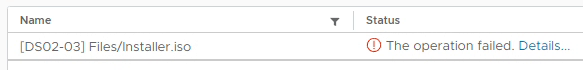
vCenter File Upload: The Operation failed.
The Problem
For this situation, the symptoms will occur when performing one of the following tasks:
Cannot Upload File to datastore
Cannot Download File from datastore
Cannot Import OVF Template
Cannot Export OVF Template
An example of errors that the user may see:
The operation failed for an undetermined reason.
The operation failed.
unexpectedStatusCode":0
unexpectedStatusCode (0)
HTTP 500 Error
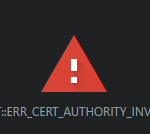
NET::ERR_CERT_AUTHORITY_INVALID
See below for some example screenshots of errors you may see.
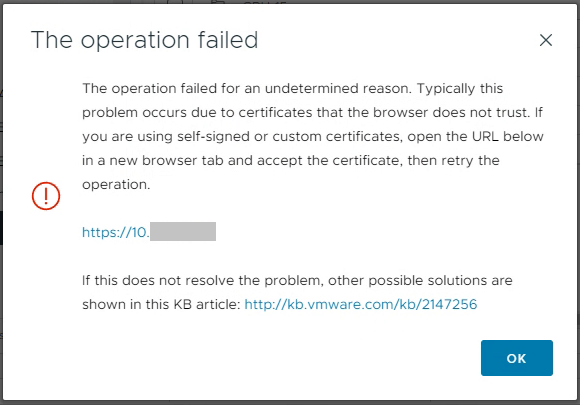
The Operation failed: The Operation failed for an undetermined reason.
“NET::ERR_CERT_AUTHORITY_INVALID”
Please note, that this condition can cause other issues and errors as well.
The Solution
When using VMware vSphere, the vCenter server acts as it’s own Root Certification Authority, and uses SSL certificates to facilitate communication and encryption between various services in the solution, as well as the communication between the vCenter Server, ESXi hosts, and any client computers accessing vCenter via the web HTML5 interface.
This Root Certification Authority running on the vCenter Server creates and issues certificates to these services and hosts, which are issues under the Root CA Certificate.
While vCenter automatically handles the certificate trusts between the services, as well as the communicate between the vCenter Server and ESXi hosts (this is automatically setup when adding hosts to vCenter), it cannot automatically make your (client) computer trust the entire certificate authority, as well as all the child certificates.
This website uses cookies to improve your experience. We'll assume you're ok with this, but you can opt-out if you wish.
Do you accept the use of cookies and accept our privacy policy? AcceptRejectCookie and Privacy Policy
Privacy & Cookies Policy
Privacy Overview
This website uses cookies to improve your experience while you navigate through the website. Out of these cookies, the cookies that are categorized as necessary are stored on your browser as they are essential for the working of basic functionalities of the website. We also use third-party cookies that help us analyze and understand how you use this website. These cookies will be stored in your browser only with your consent. You also have the option to opt-out of these cookies. But opting out of some of these cookies may have an effect on your browsing experience.