Looking to add quad (4) NVMe SSDs to your system and don’t have the M.2 slots or a motherboard that supports bifurcation? The IOCREST IO-PEX40152 QUAD NVMe PCIe card, is the card for you!
The IO-PEX40152 PCIe card allows you to add 4 NVMe SSDs to a computer, workstation, or server that has an available PCIe x16 slot. This card has a built in PEX PCIe switch chip, so your motherboard does not need to support bifurcation. This card can essentially be installed and used in any system with a free x16 slot.
This card is also available under the PART# SI-PEX40152.
In this post I’ll be reviewing the IOCREST IO-PEX40152, providing information on how to buy, benchmarks, installation, configuration and more! I’ve also posted tons of pics for your viewing pleasure. I installed this card in an HPE DL360p Gen8 server to add NVME capabilities to create an NVMe based Storage Server.
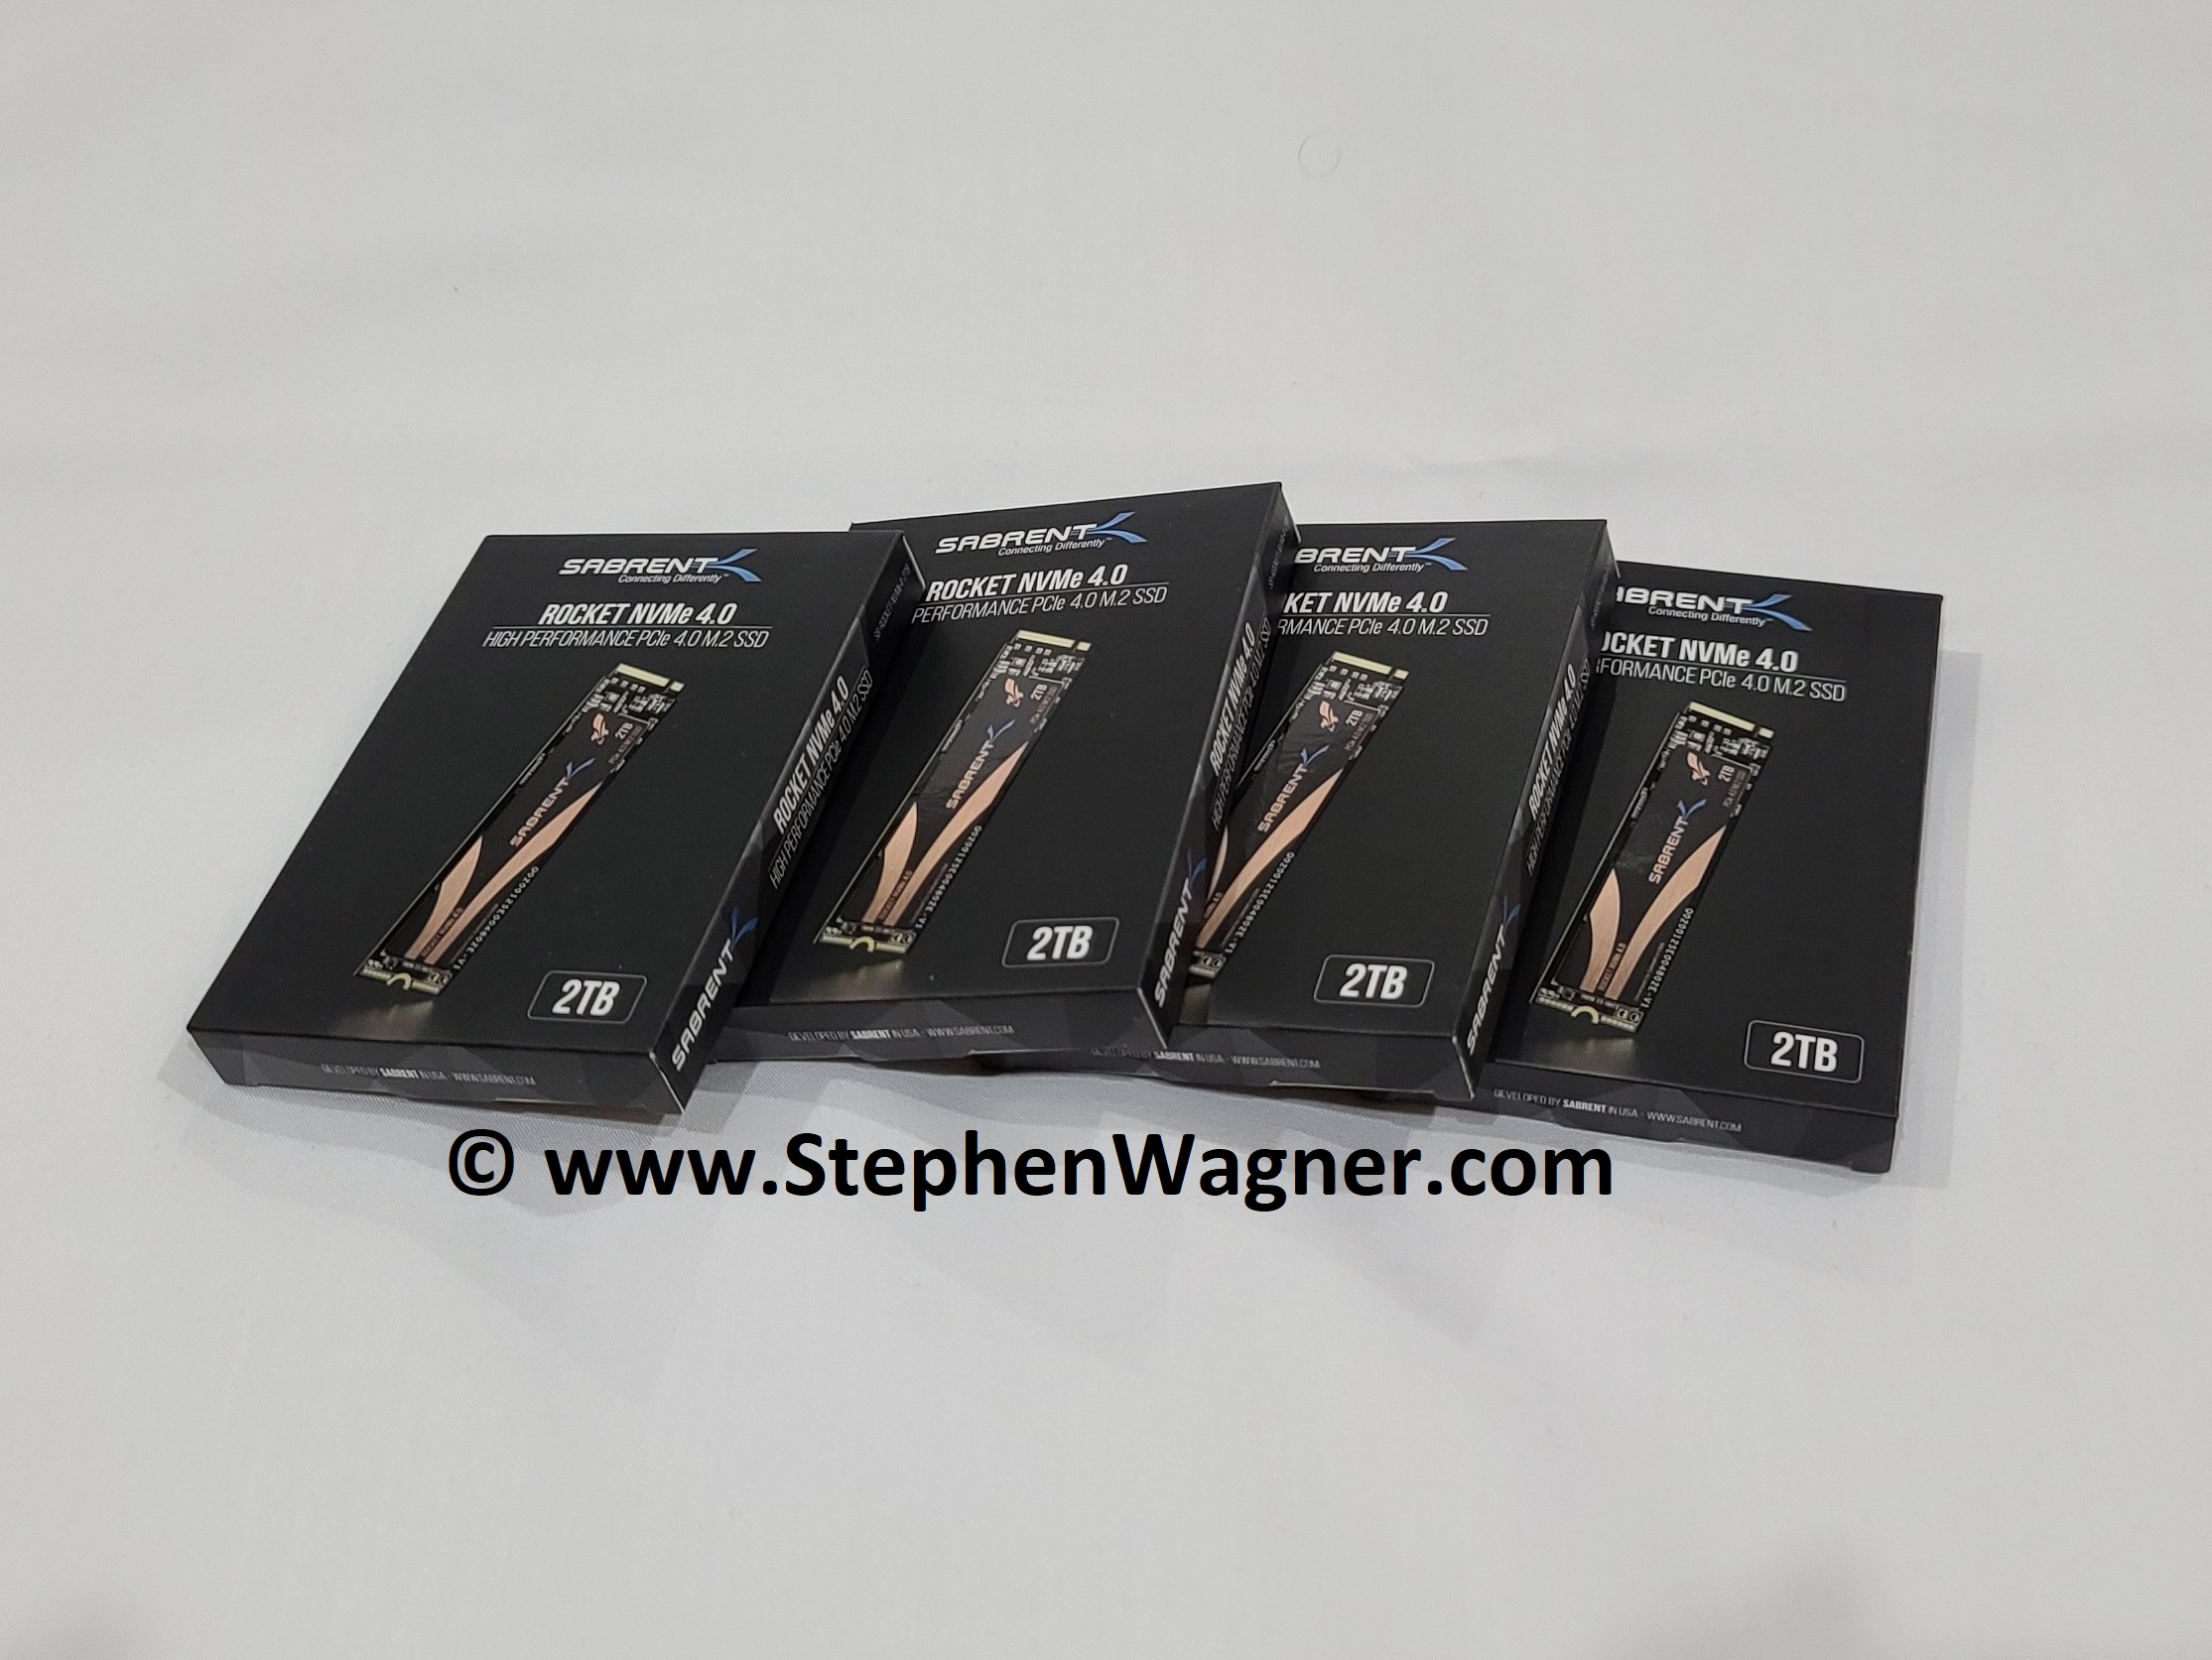
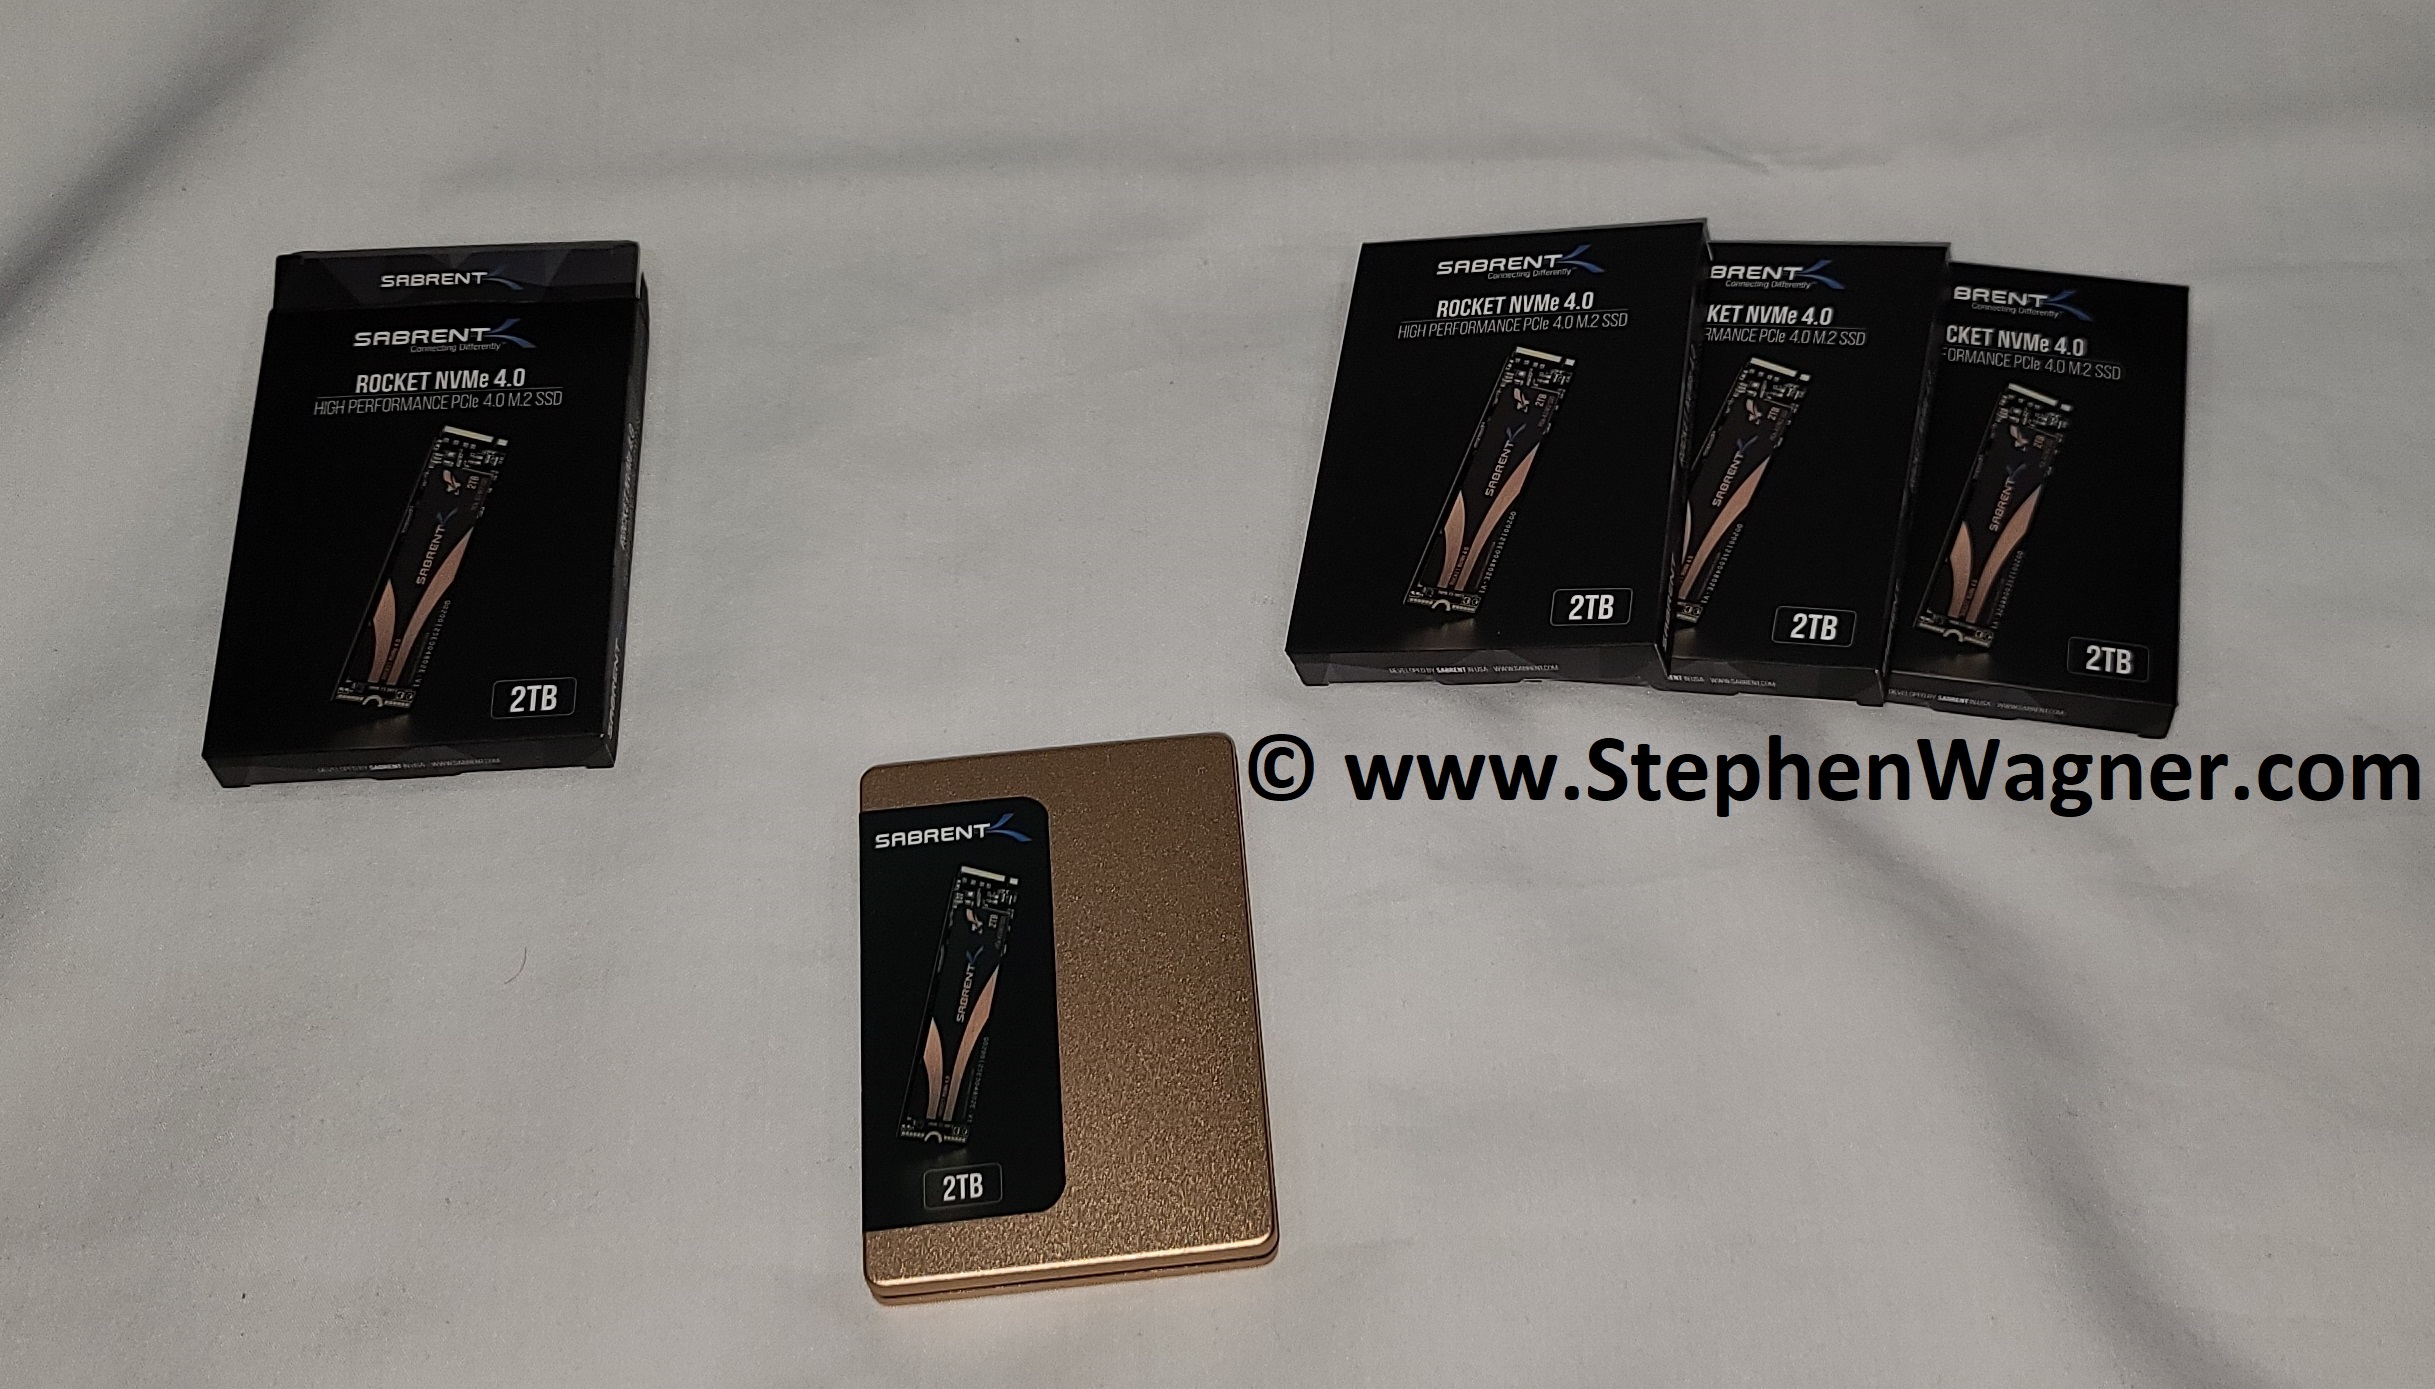
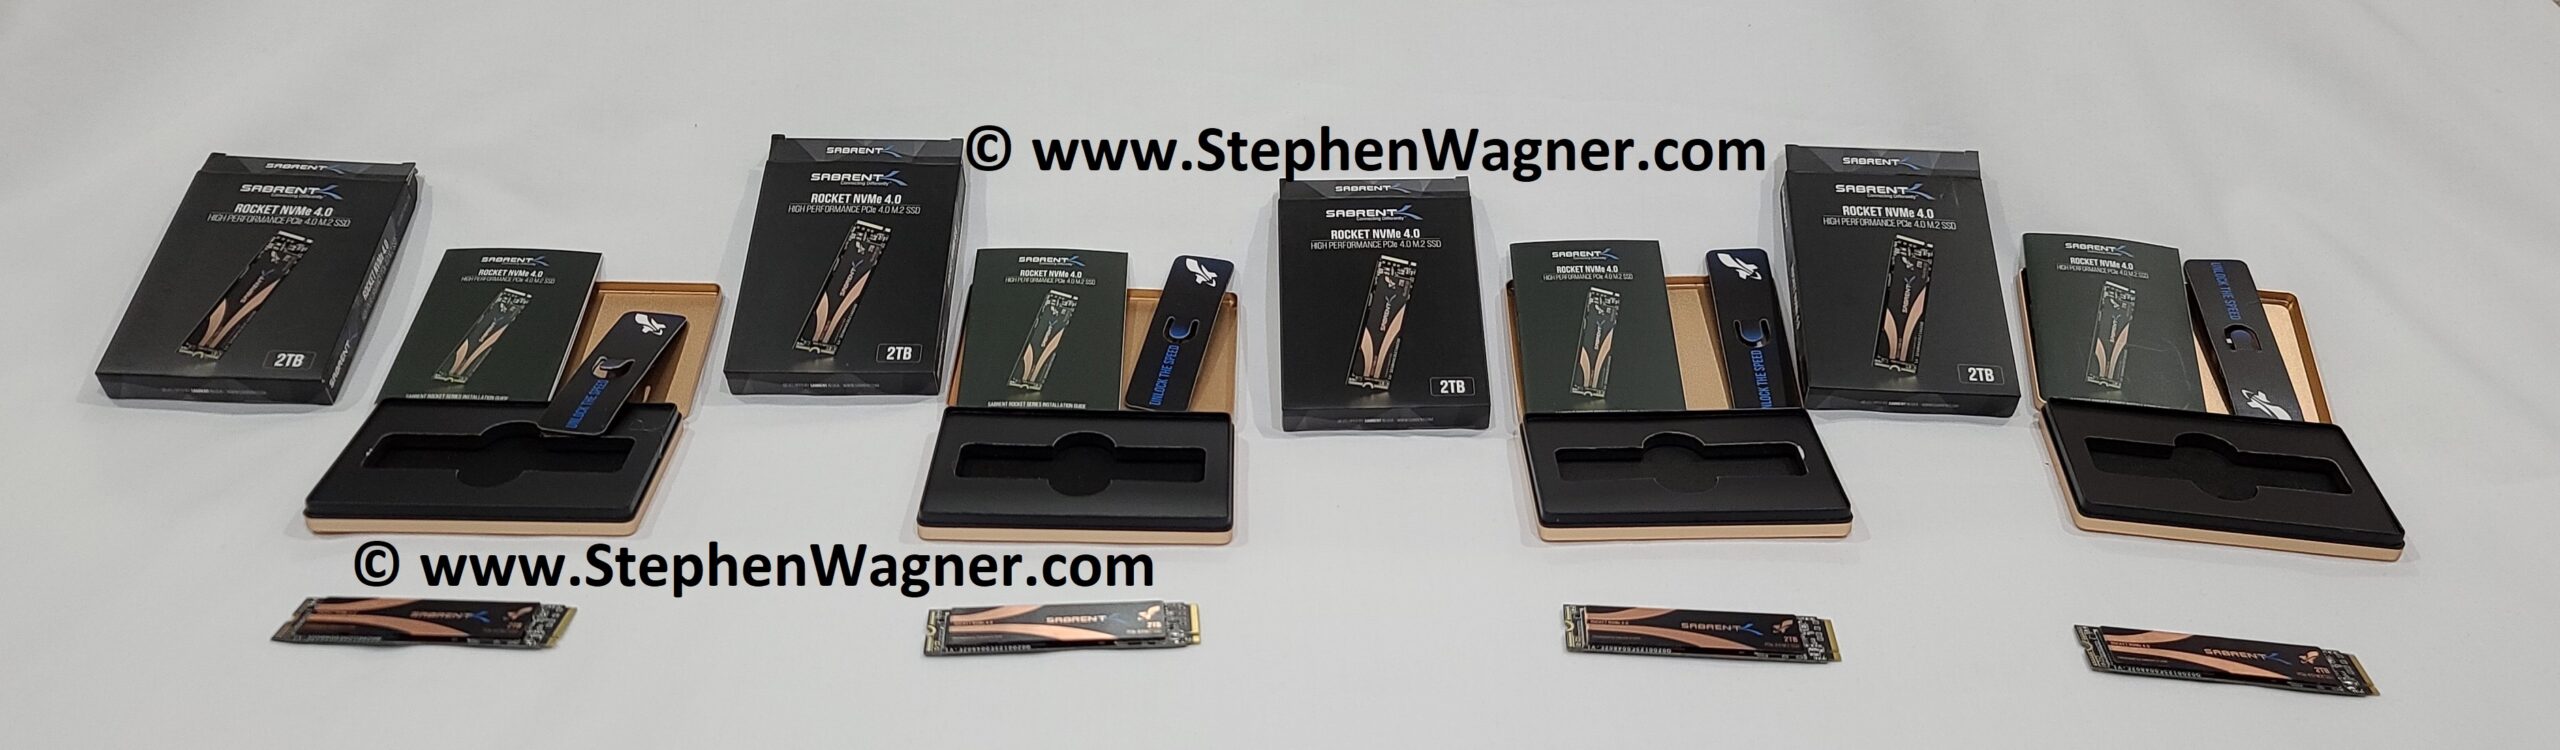
We’ll be using and reviewing this card populated with 4 x Sabrent Rocket 4 PCIe NVMe SSD, you can see the review on those SSD’s individually here.
Why and How I purchased the card
Originally I purchased this card for a couple of special and interesting projects I’m working on for the blog and my homelab. I needed a card that provided high density NVME flash storage, but didn’t require bifurcation as I planned on using it on a motherboard that didn’t support 4/4/4/4 bifurcation.
By choosing this specific card, I could also use it in any other system that had an available x16 PCIe slot.
I considered many other cards (such as some from SuperMicro and Intel), but in the end chose this one as it seemed most likely to work for my application. The choices from SuperMicro and Intel looked like they are designed to be use on their own systems.
I purchased the IO-PEX40152 from the IOCREST AliExpress store (after verifying it was their genuine online store) and they had the most cost-effective price out of the 4 sources.
They shipped the card with FedEx International Priority, so I received it within a week. Super fast shipping and it was packed perfectly!
Where to buy the IO-PEX40152
I found 3 different sources to purchase the IO-PEX40152 from:
- IOCREST AliExpress Store – https://www.aliexpress.com/i/4000359673743.html
- Amazon.com – https://www.amazon.com/IO-CREST-Non-RAID-Bifurcation-Controller/dp/B083GLR3WL/
- Syba USA – Through their network of resellers or distributors at https://www.sybausa.com/index.php?route=information/wheretobuy
Note that Syba USA is selling the IO-PEX40152 as the SI-PEX40152. The card I actually received has branding that identifies it both as an IO-PEX40152 and an SI-PEX40152.
As I mentioned above, I purchased it from the IOCREST AliExpress Online Store for around $299.00USD. From Amazon, the card was around $317.65USD.
IO-PEX40152 Specifications
Now let’s talk about the technical specifications of the card.
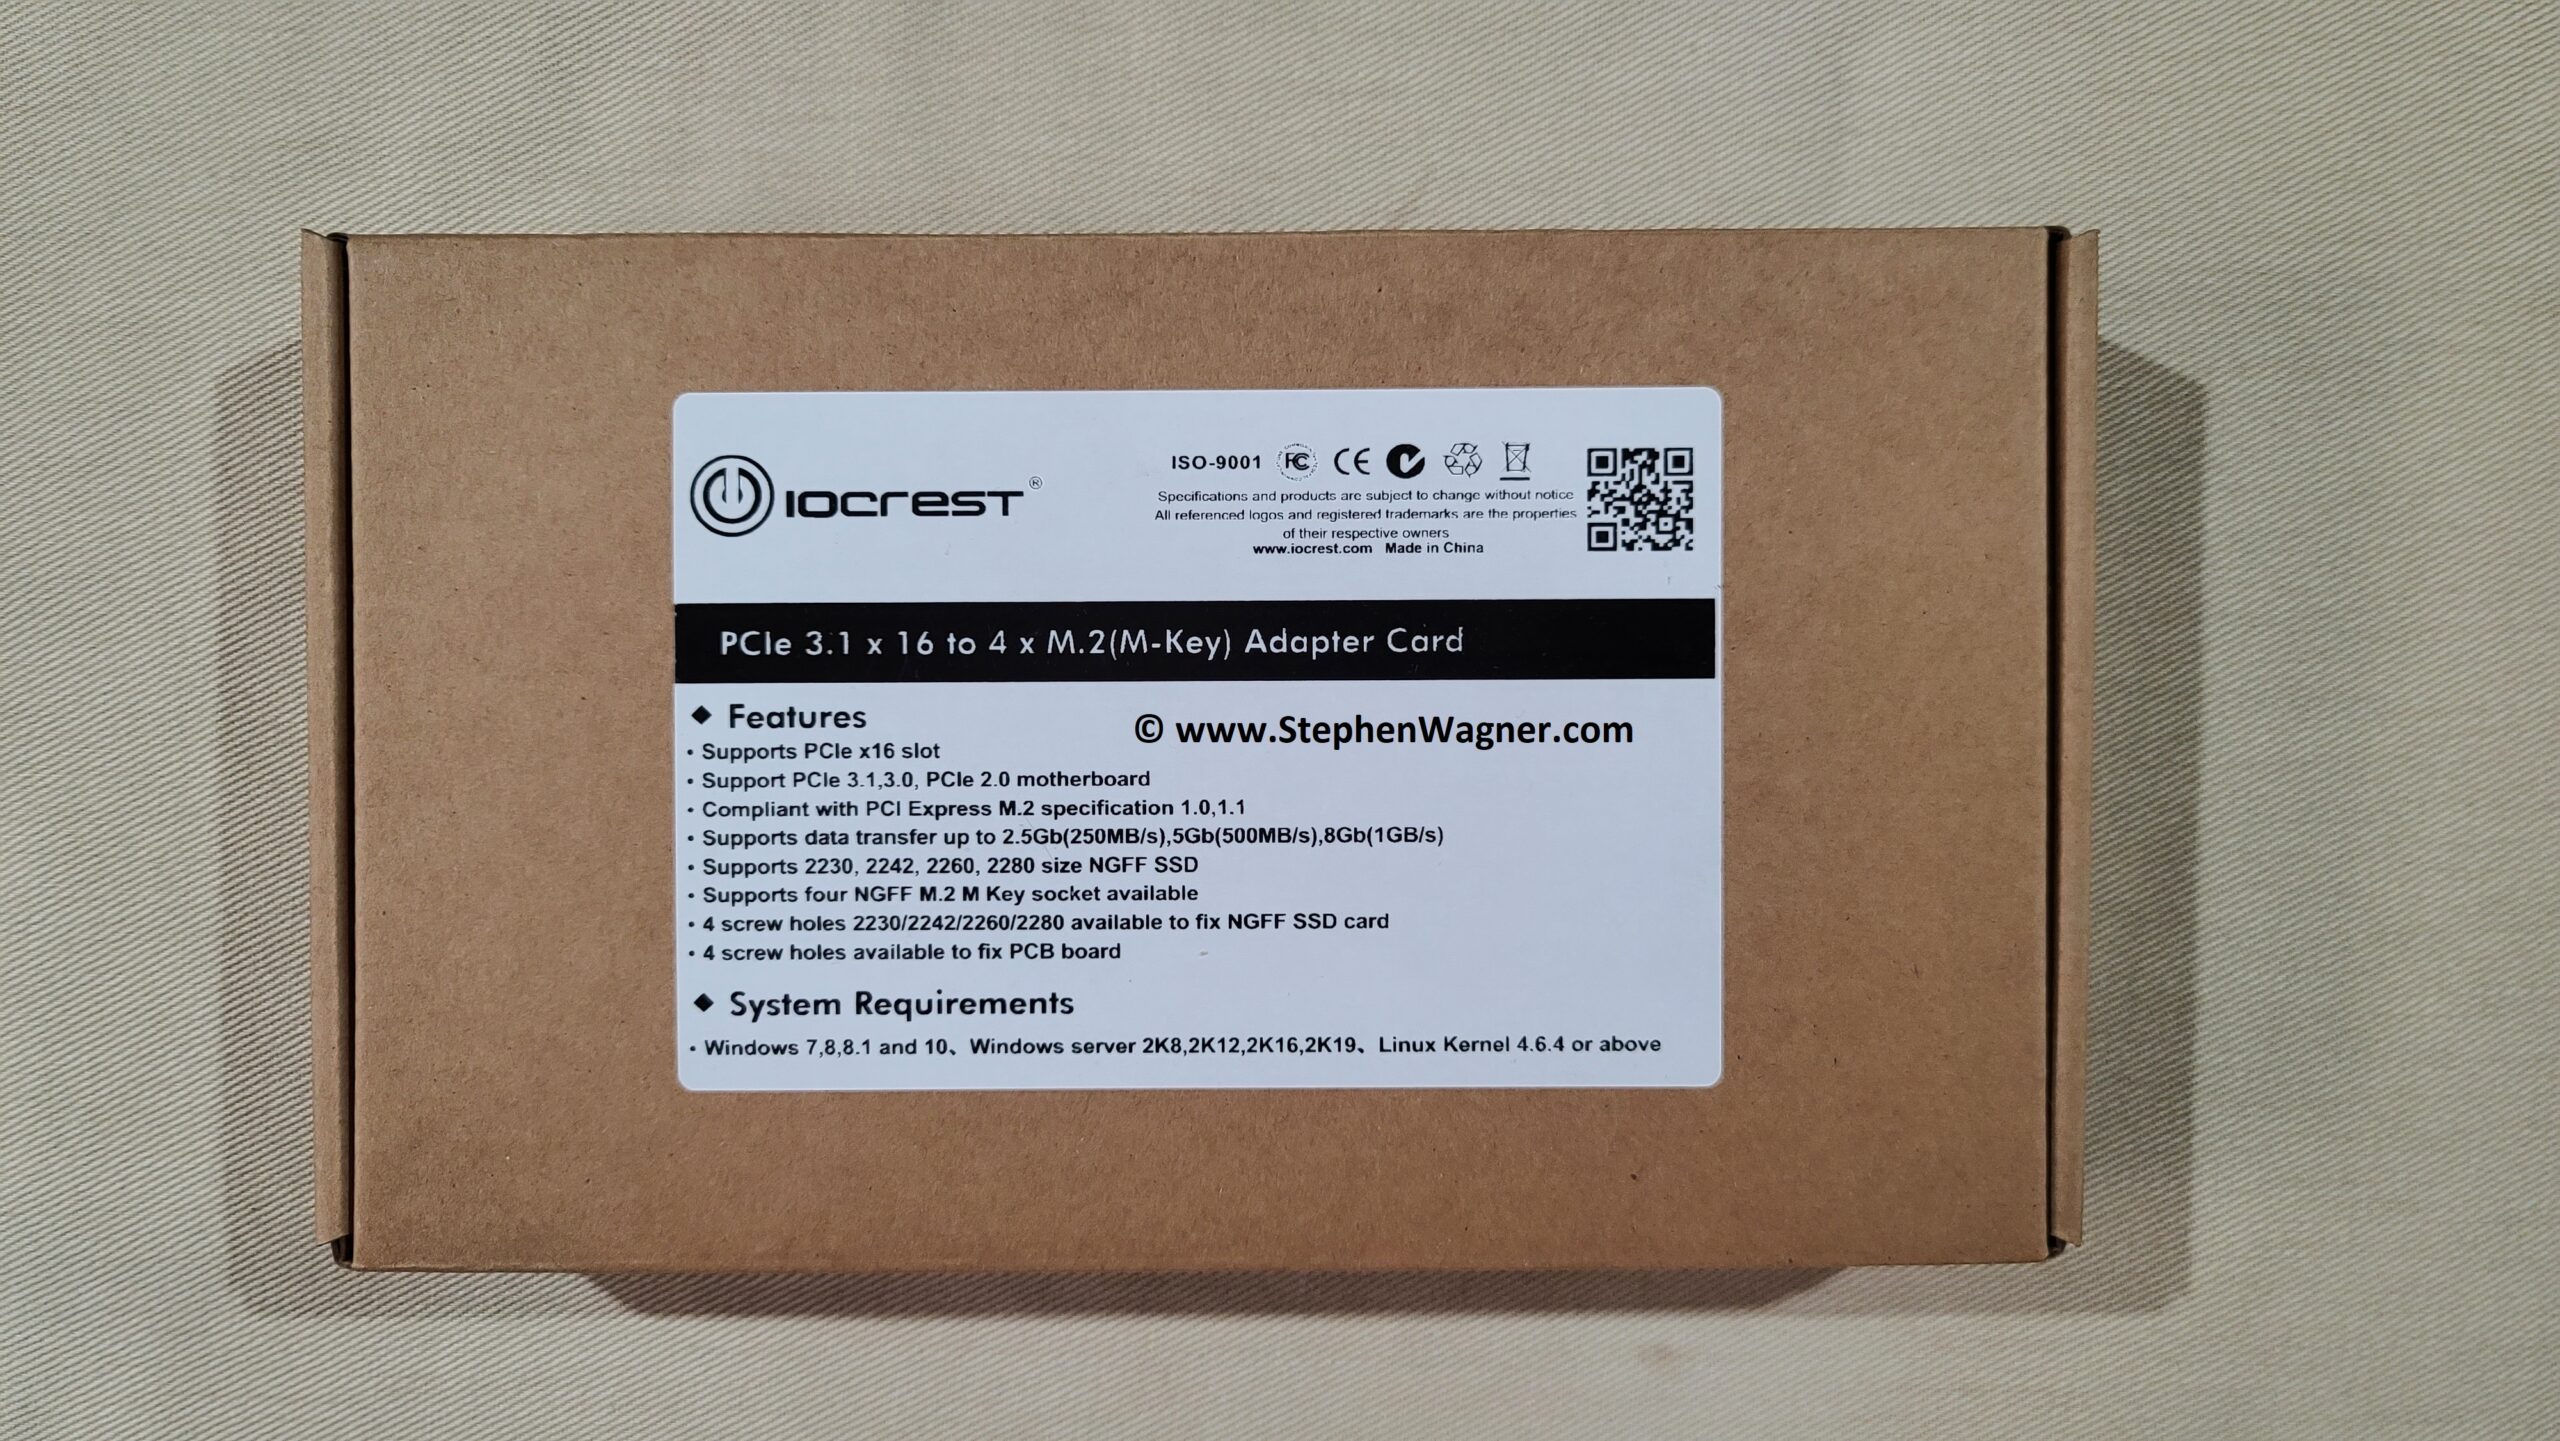
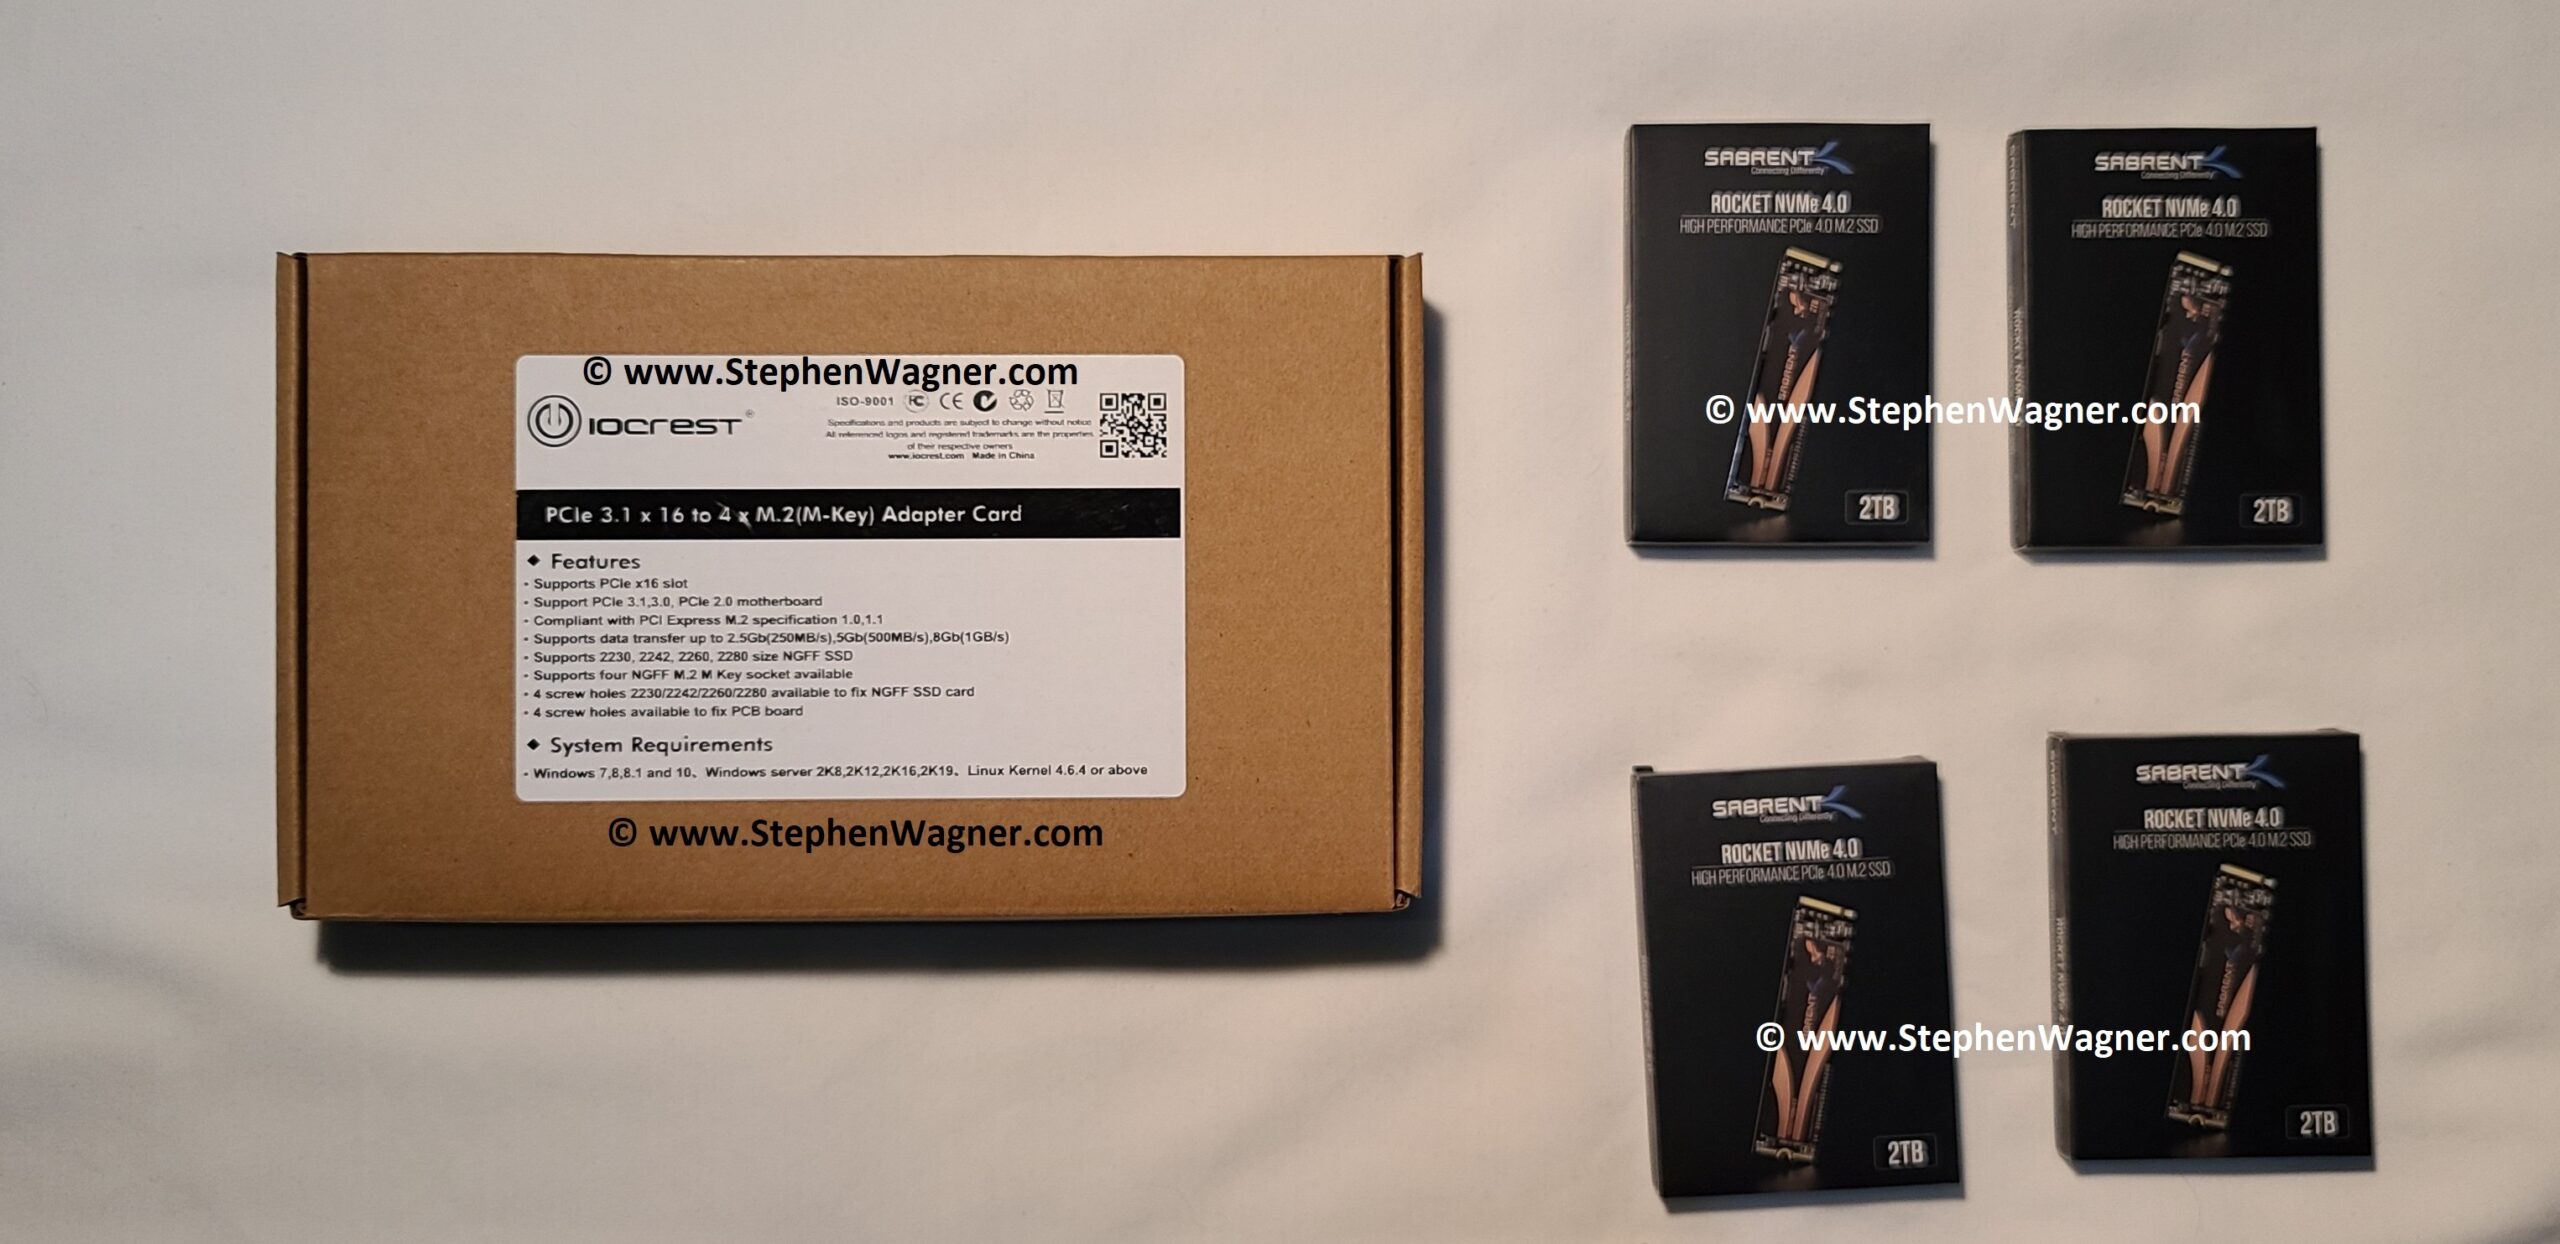
According to the packaging, the IO-PEX40152 features the following:
- Installation in a PCIe x16 slot
- Supports PCIe 3.1, 3.0, 2.0
- Compliant with PCI Express M.2 specification 1.0, 1.2
- Supports data transfer up to 2.5Gb (250MB/sec), 5Gb (500MB/sec), 8Gb (1GB/sec)
- Supports 2230, 2242, 2260, 2280 size NGFF SSD
- Supports four (4) NGFF M.2 M Key sockets
- 4 screw holes 2230/2242/2260/2280 available to fix NGFF SSD card
- 4 screw holes available to fix PCB board to heatsink
- Supports Windows 10 (and 7, 8, 8.1)
- Supports Windows Server 2019 (and 2008, 2012, 2016)
- Supports Linux (Kernel version 4.6.4 or above)
While this list of features and specs are listed on the website and packaging, I’m not sure how accurate some of these statements are (in a good way), I’ll cover that more later in the post.
What’s included in the packaging?
- 1 x IO-PEX40152 PCIe x 16 to 4 x M.2(M-Key) card
- 1 x User Manual
- 1 x M.2 Mounting material
- 1 x Screwdriver
- 5 x self-adhesive thermal pad
They also note that contents may vary depending on country and market.
Unboxing, Installation, and Configuration
As menitoned above, our build includes:
- 1 x IOCREST IO-PEX40152
- 4 x Sabrent Rocket 4 NVMe PCIe NVMe SSD
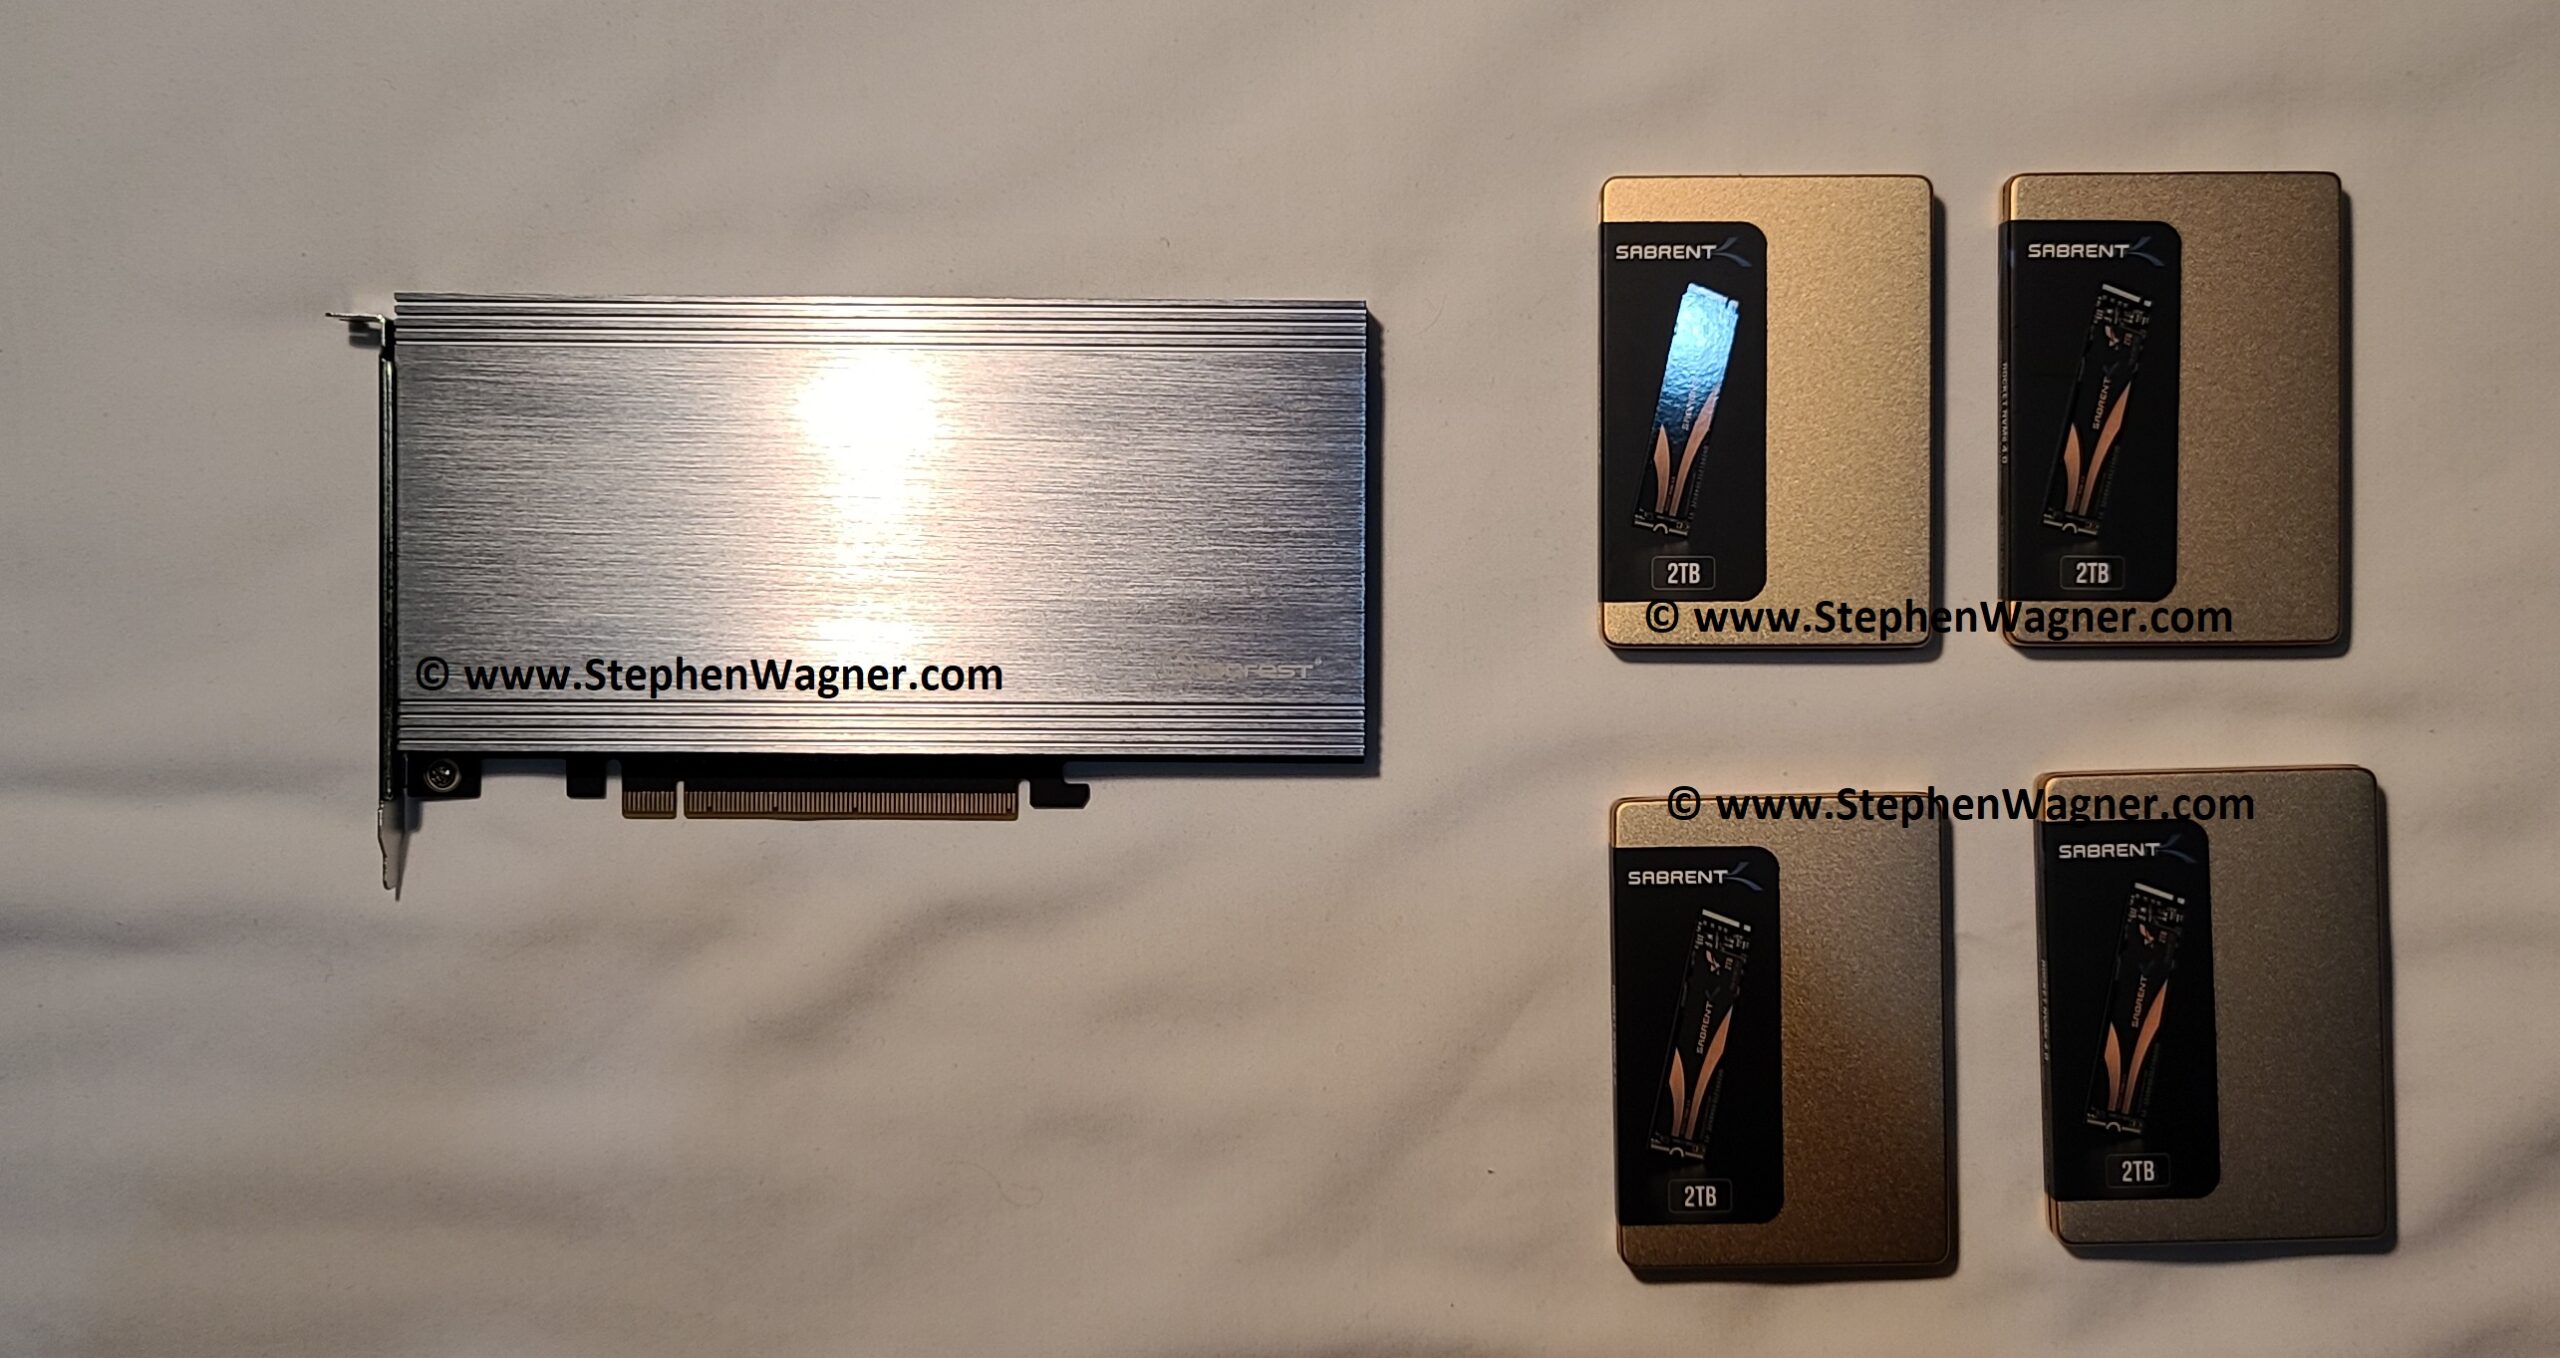
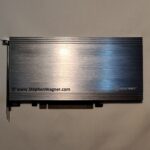
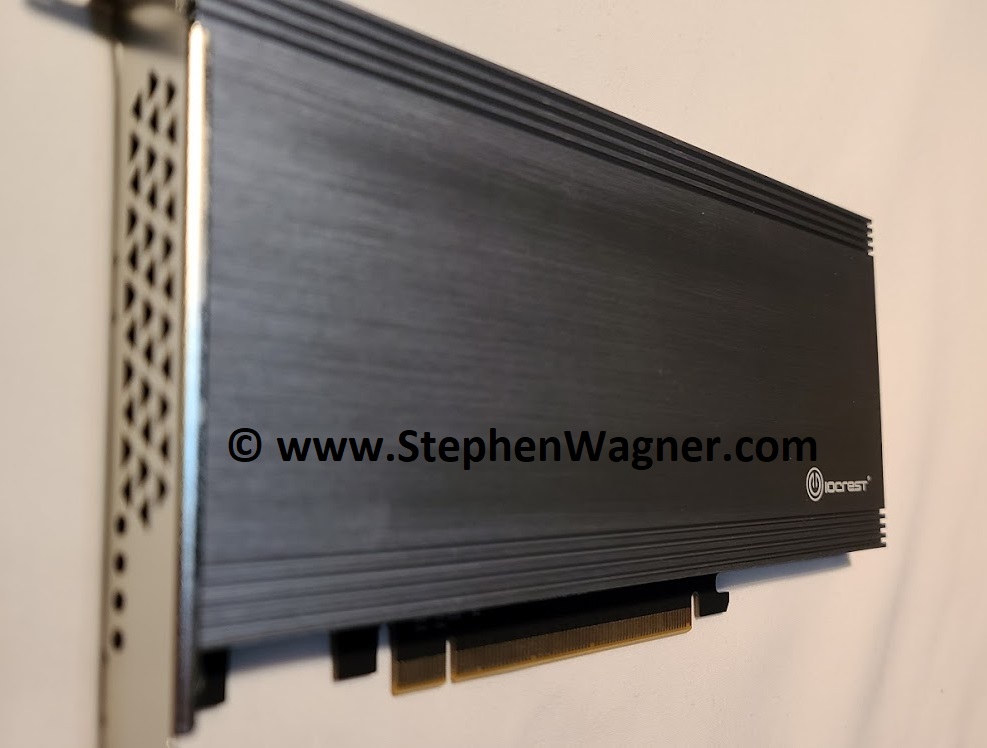
You’ll notice it’s a very sleek looking card. The heatsink is beefy, heavy, and very metal (duh)! The card is printed on a nice black PCB.
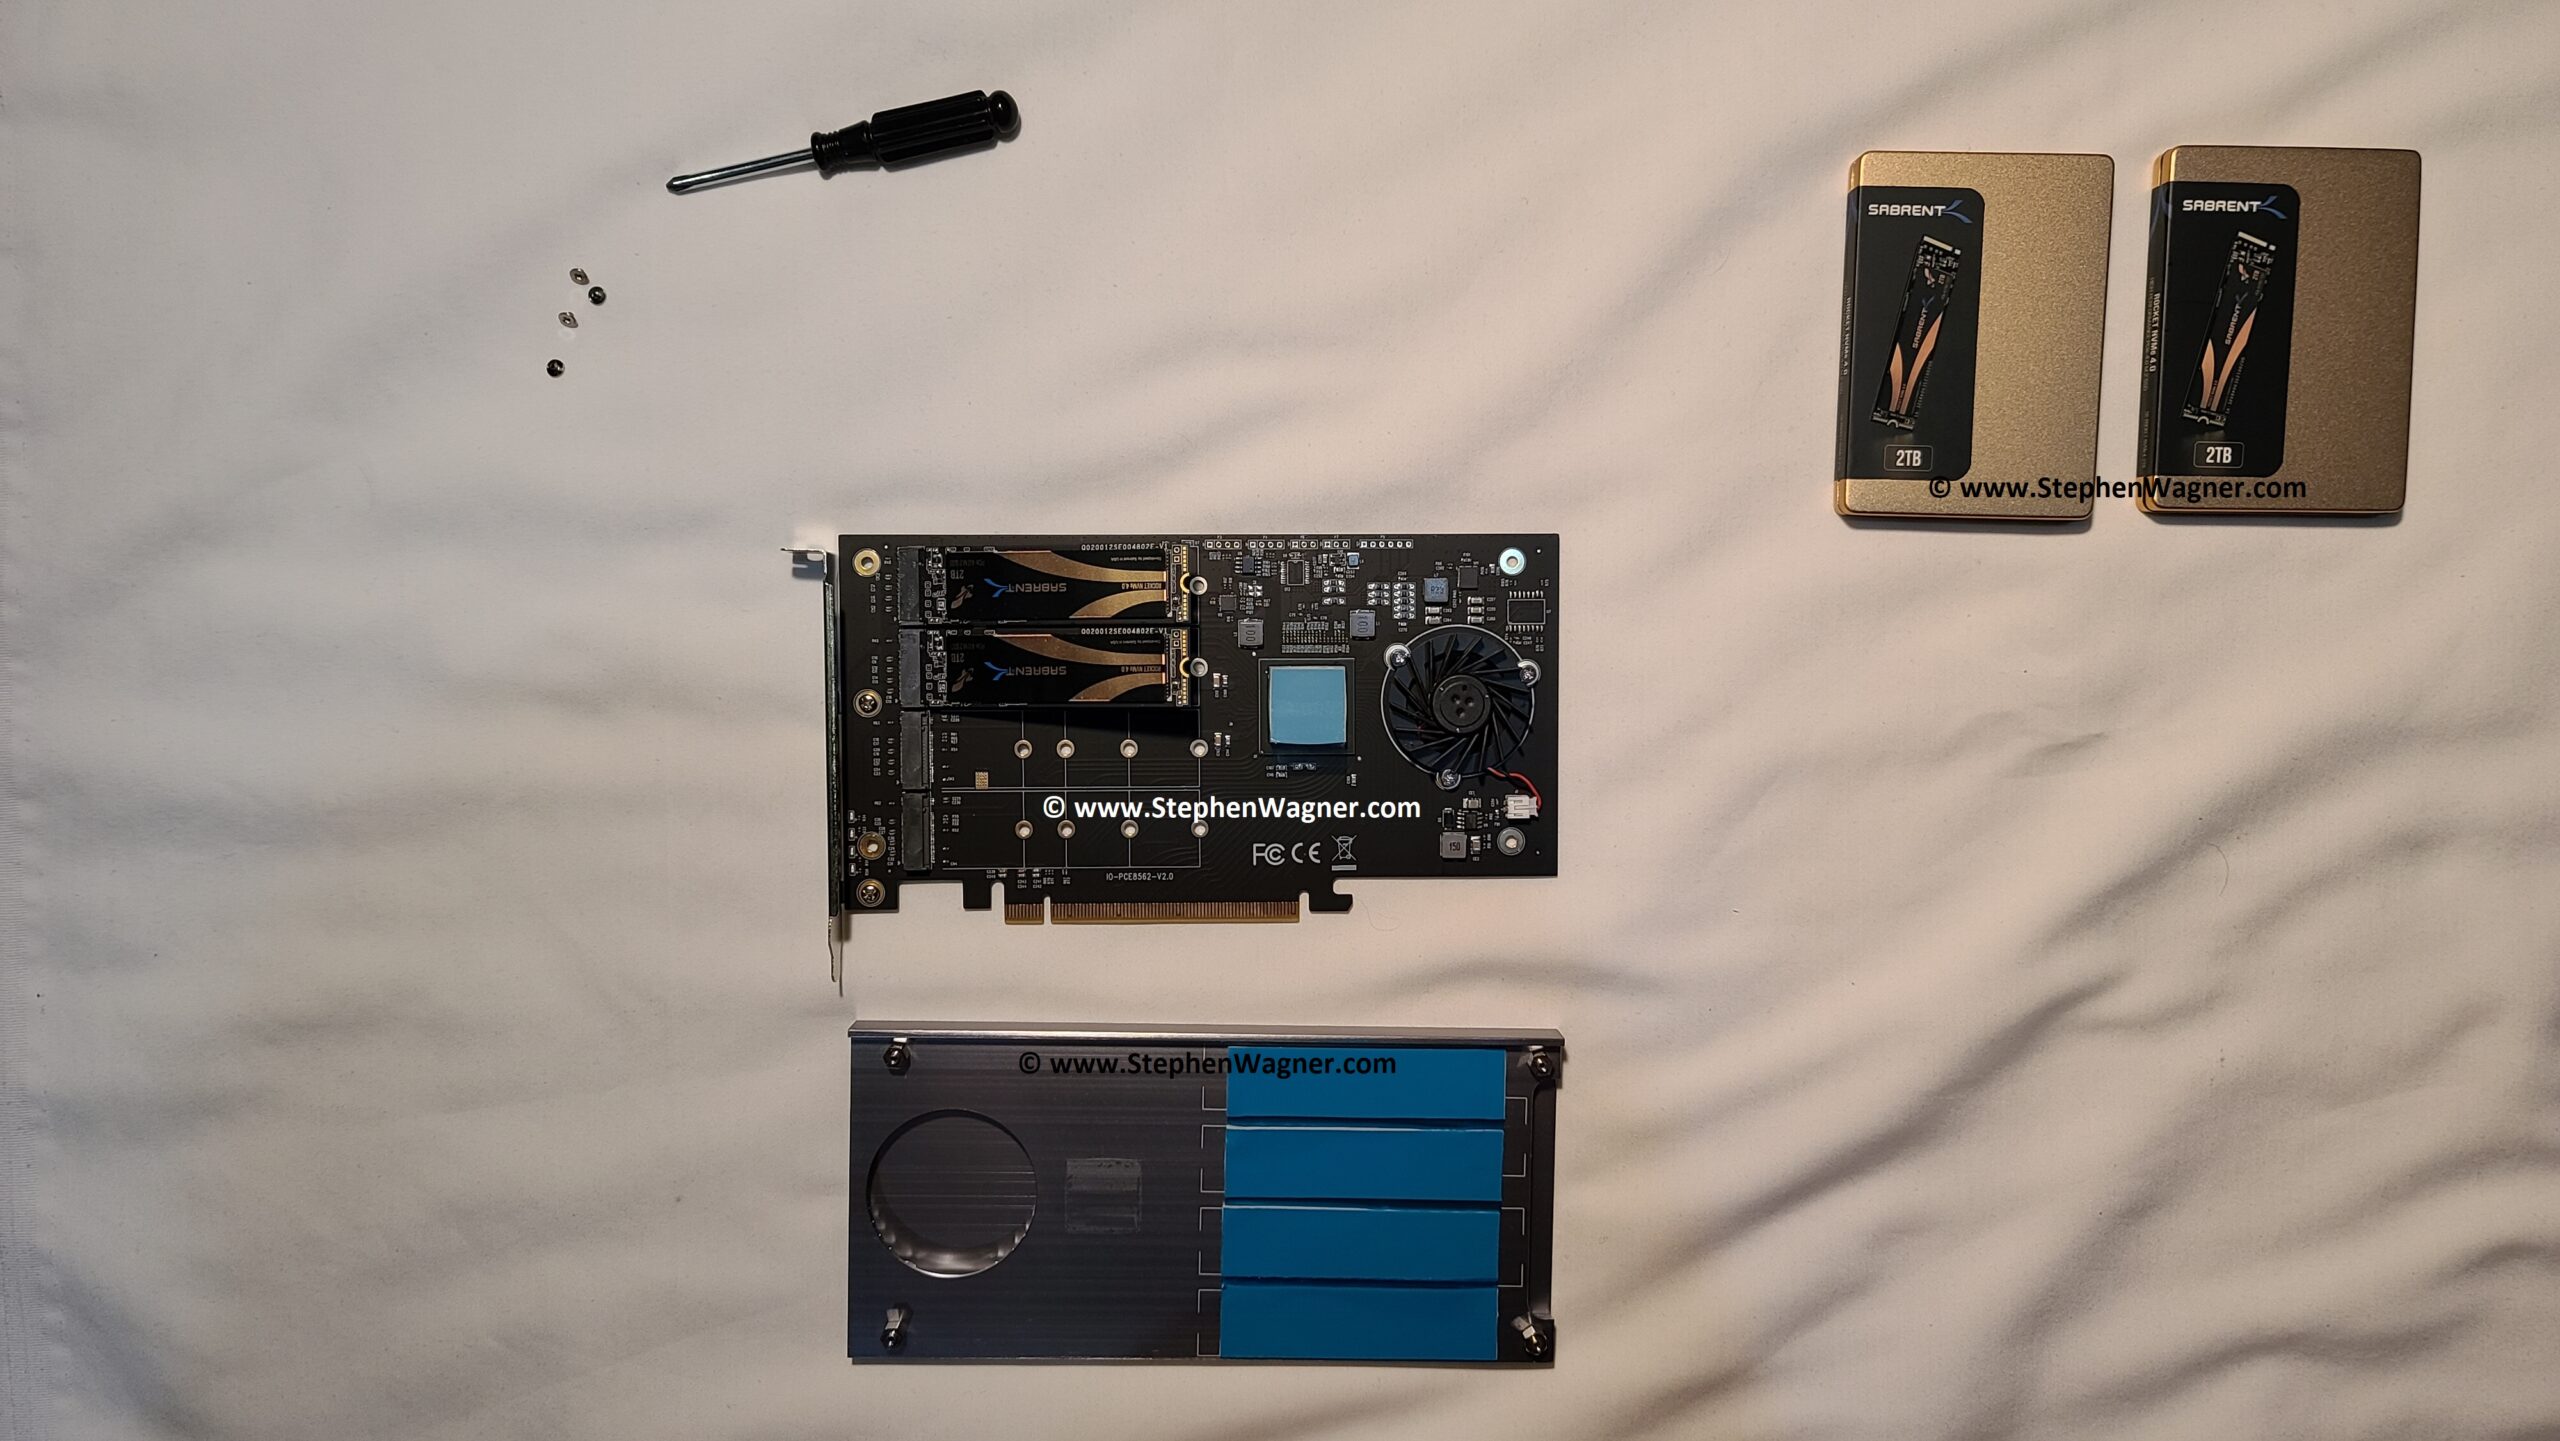
Removing the 4 screws to release the heatsink, we see the card and thermal paste pads. You’ll notice the PCIe switch chip.
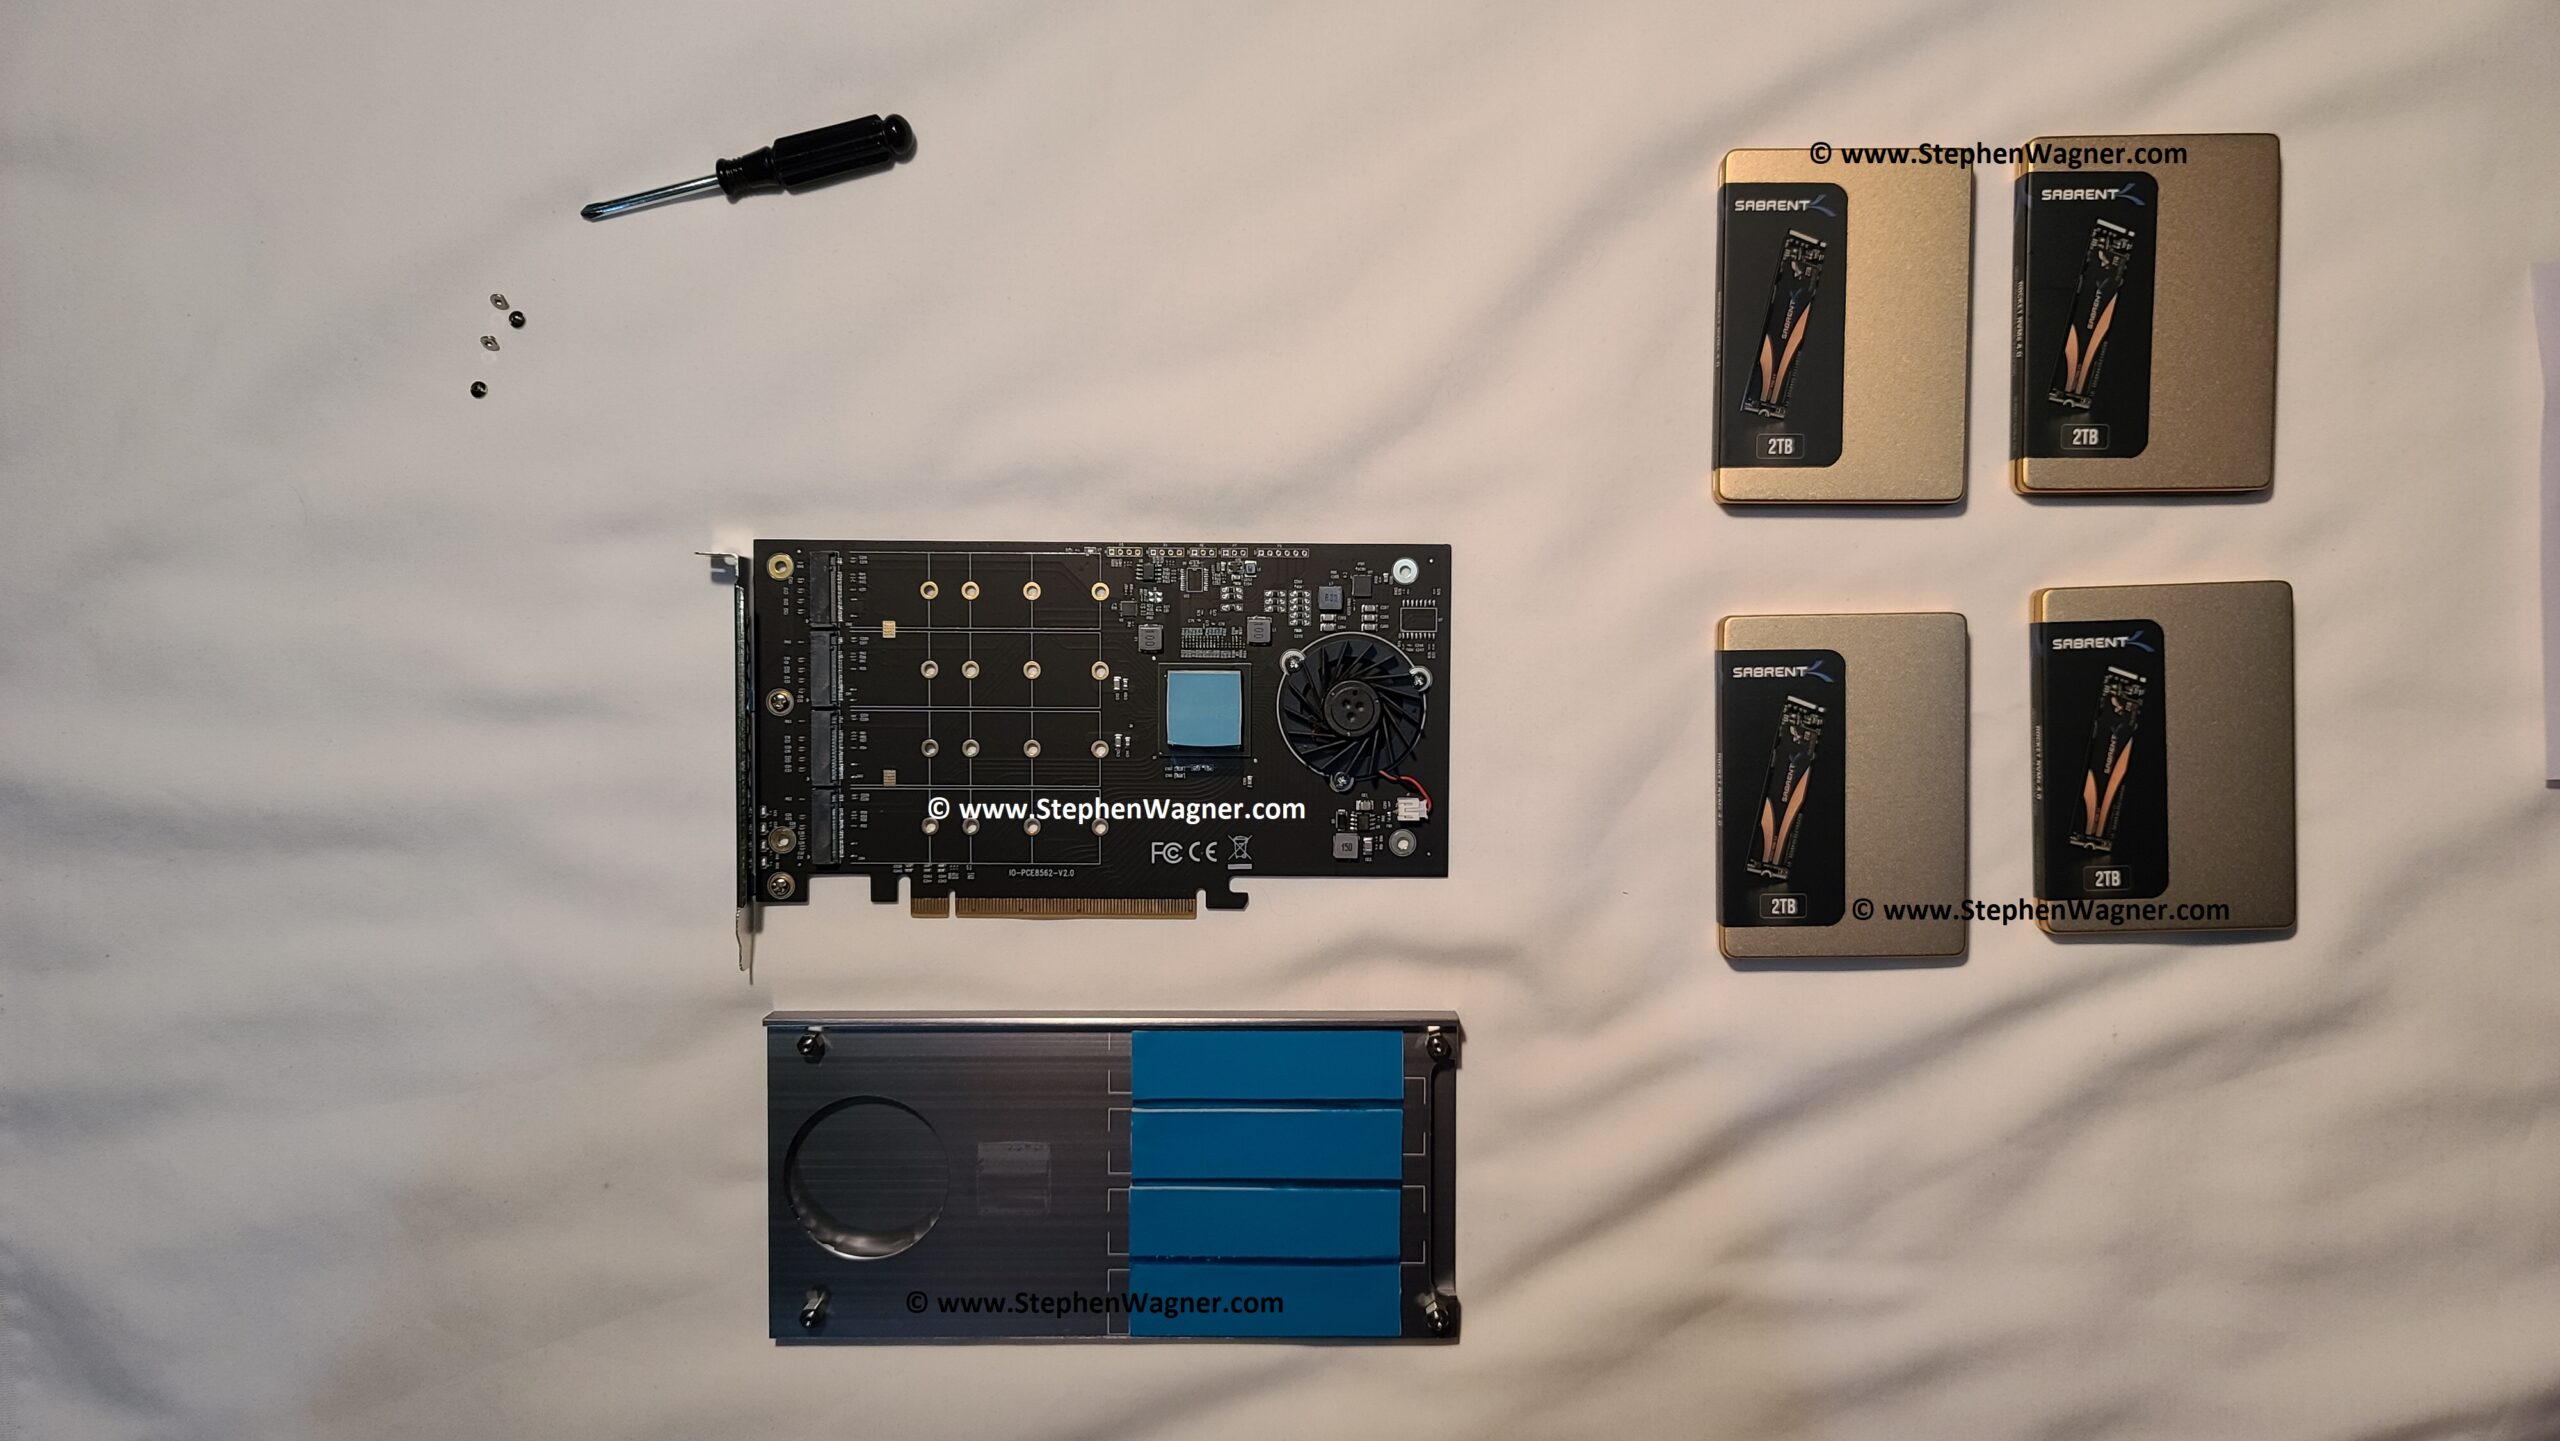
And the backside of the card.
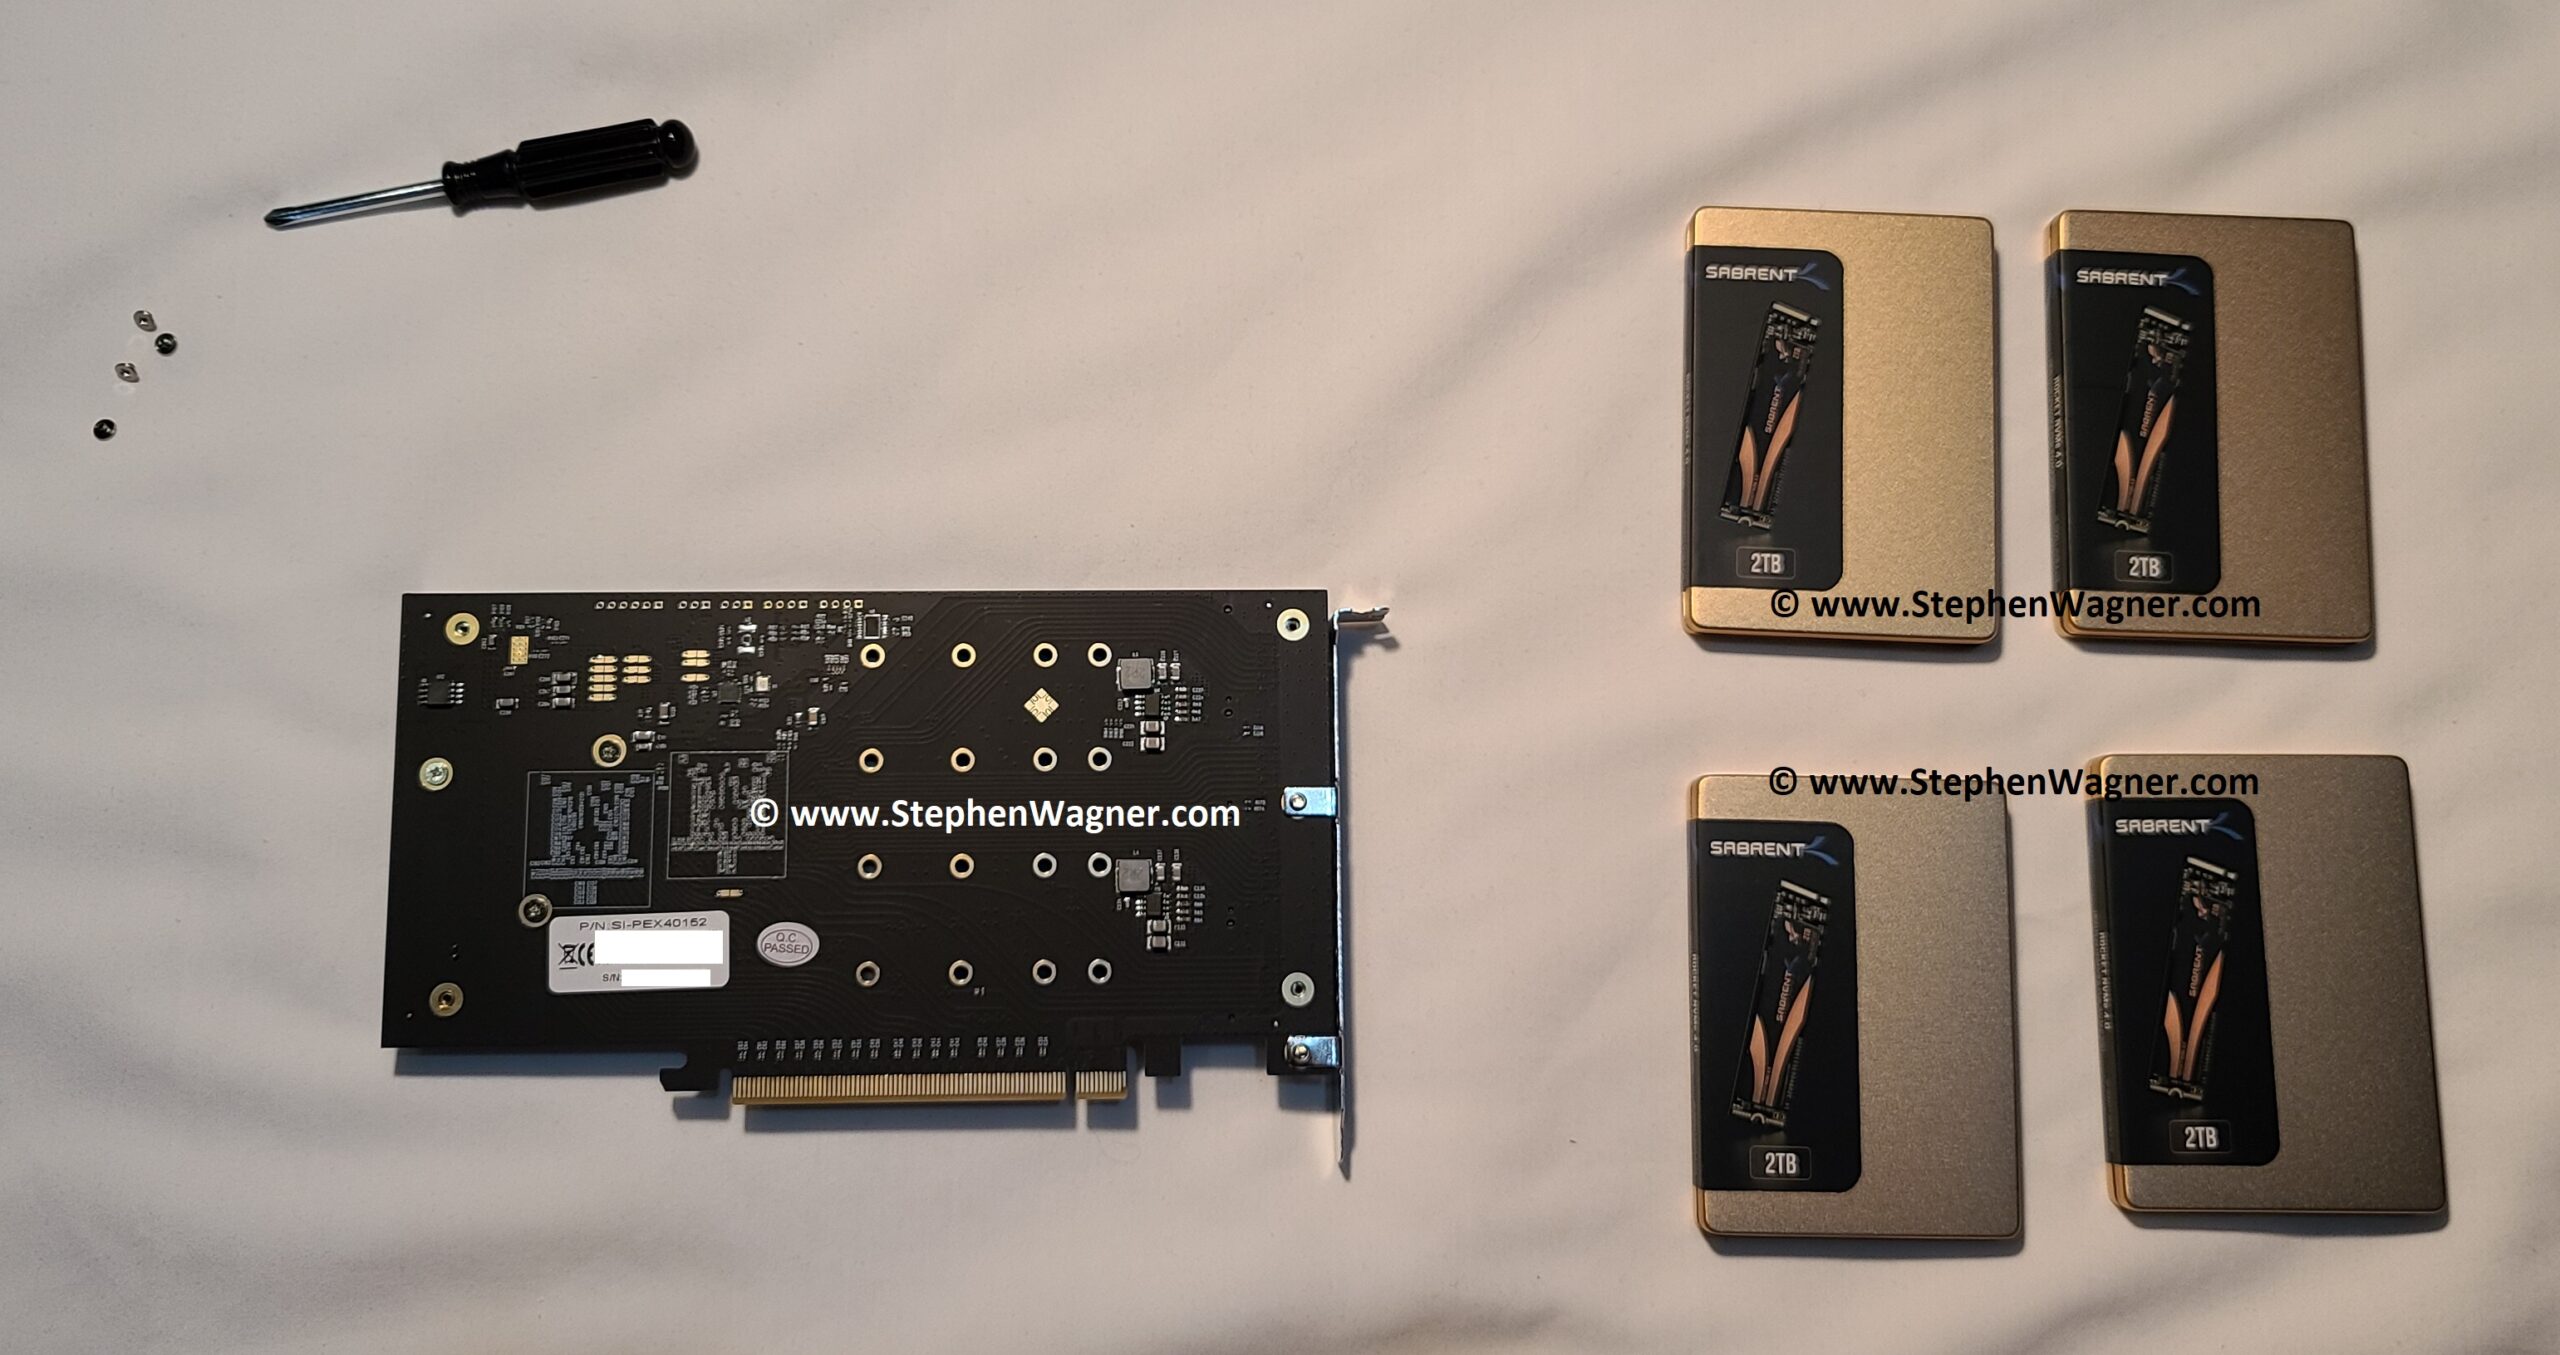
NVMe Installation
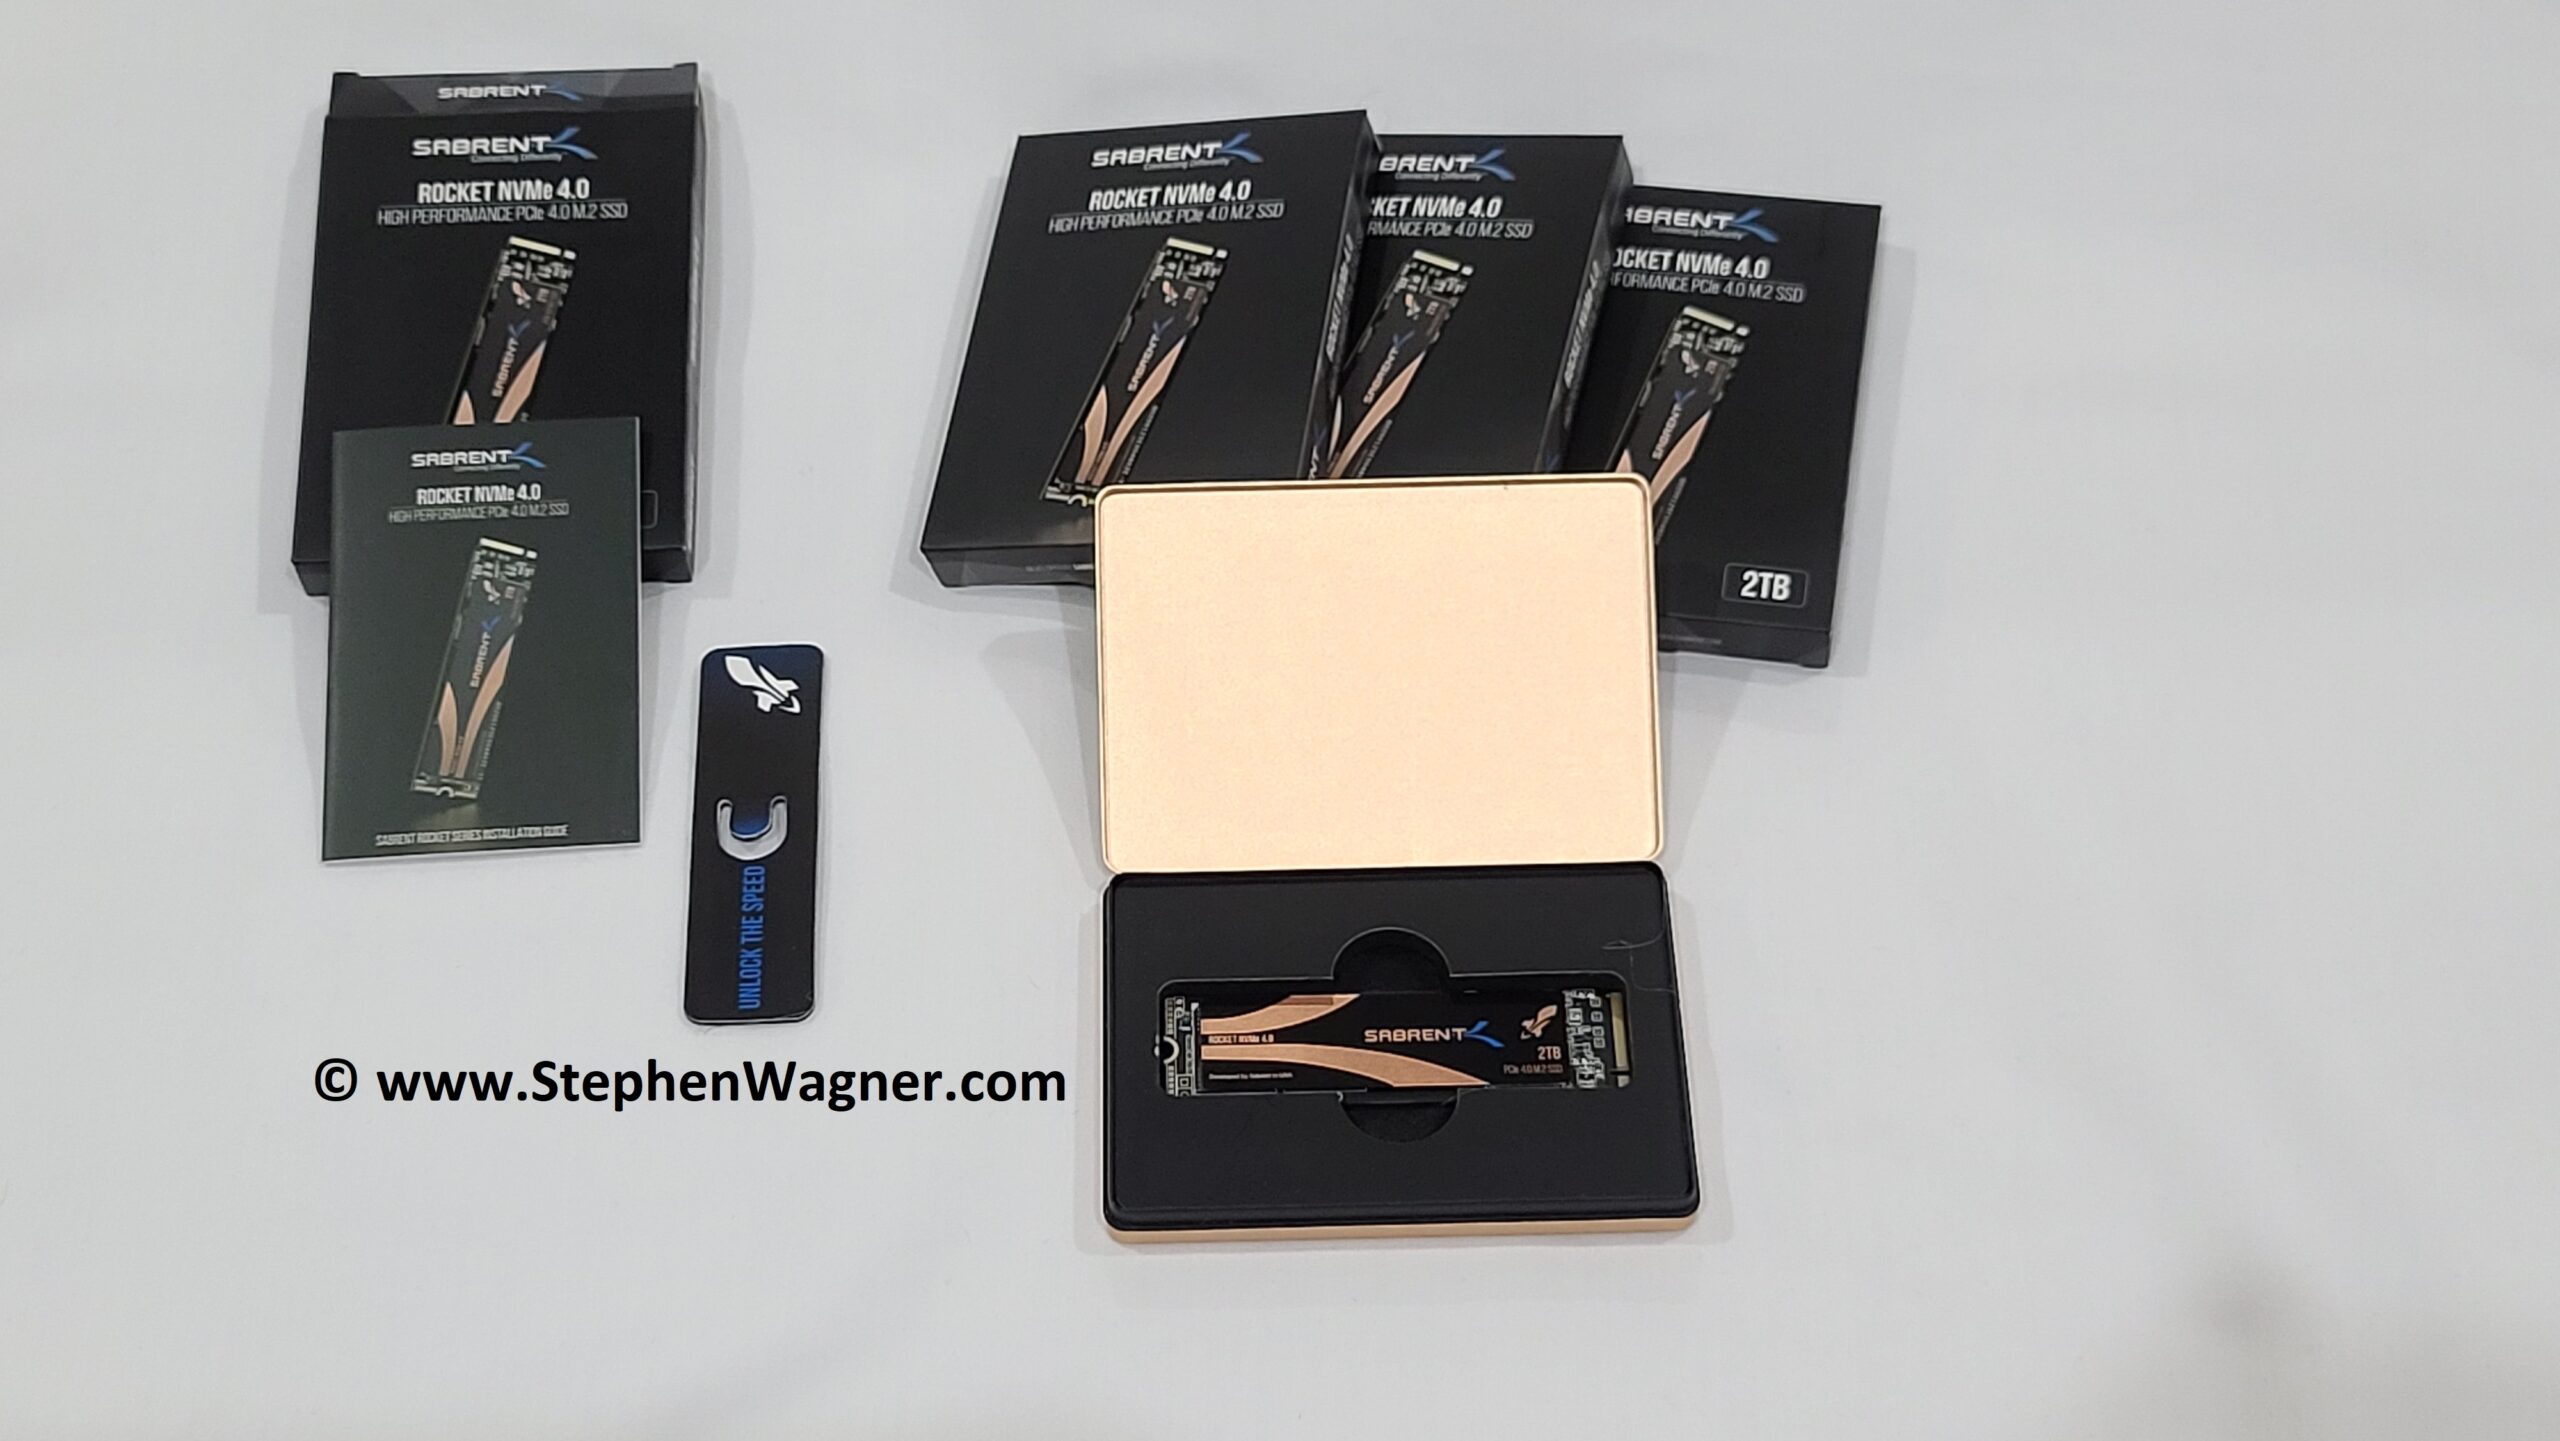
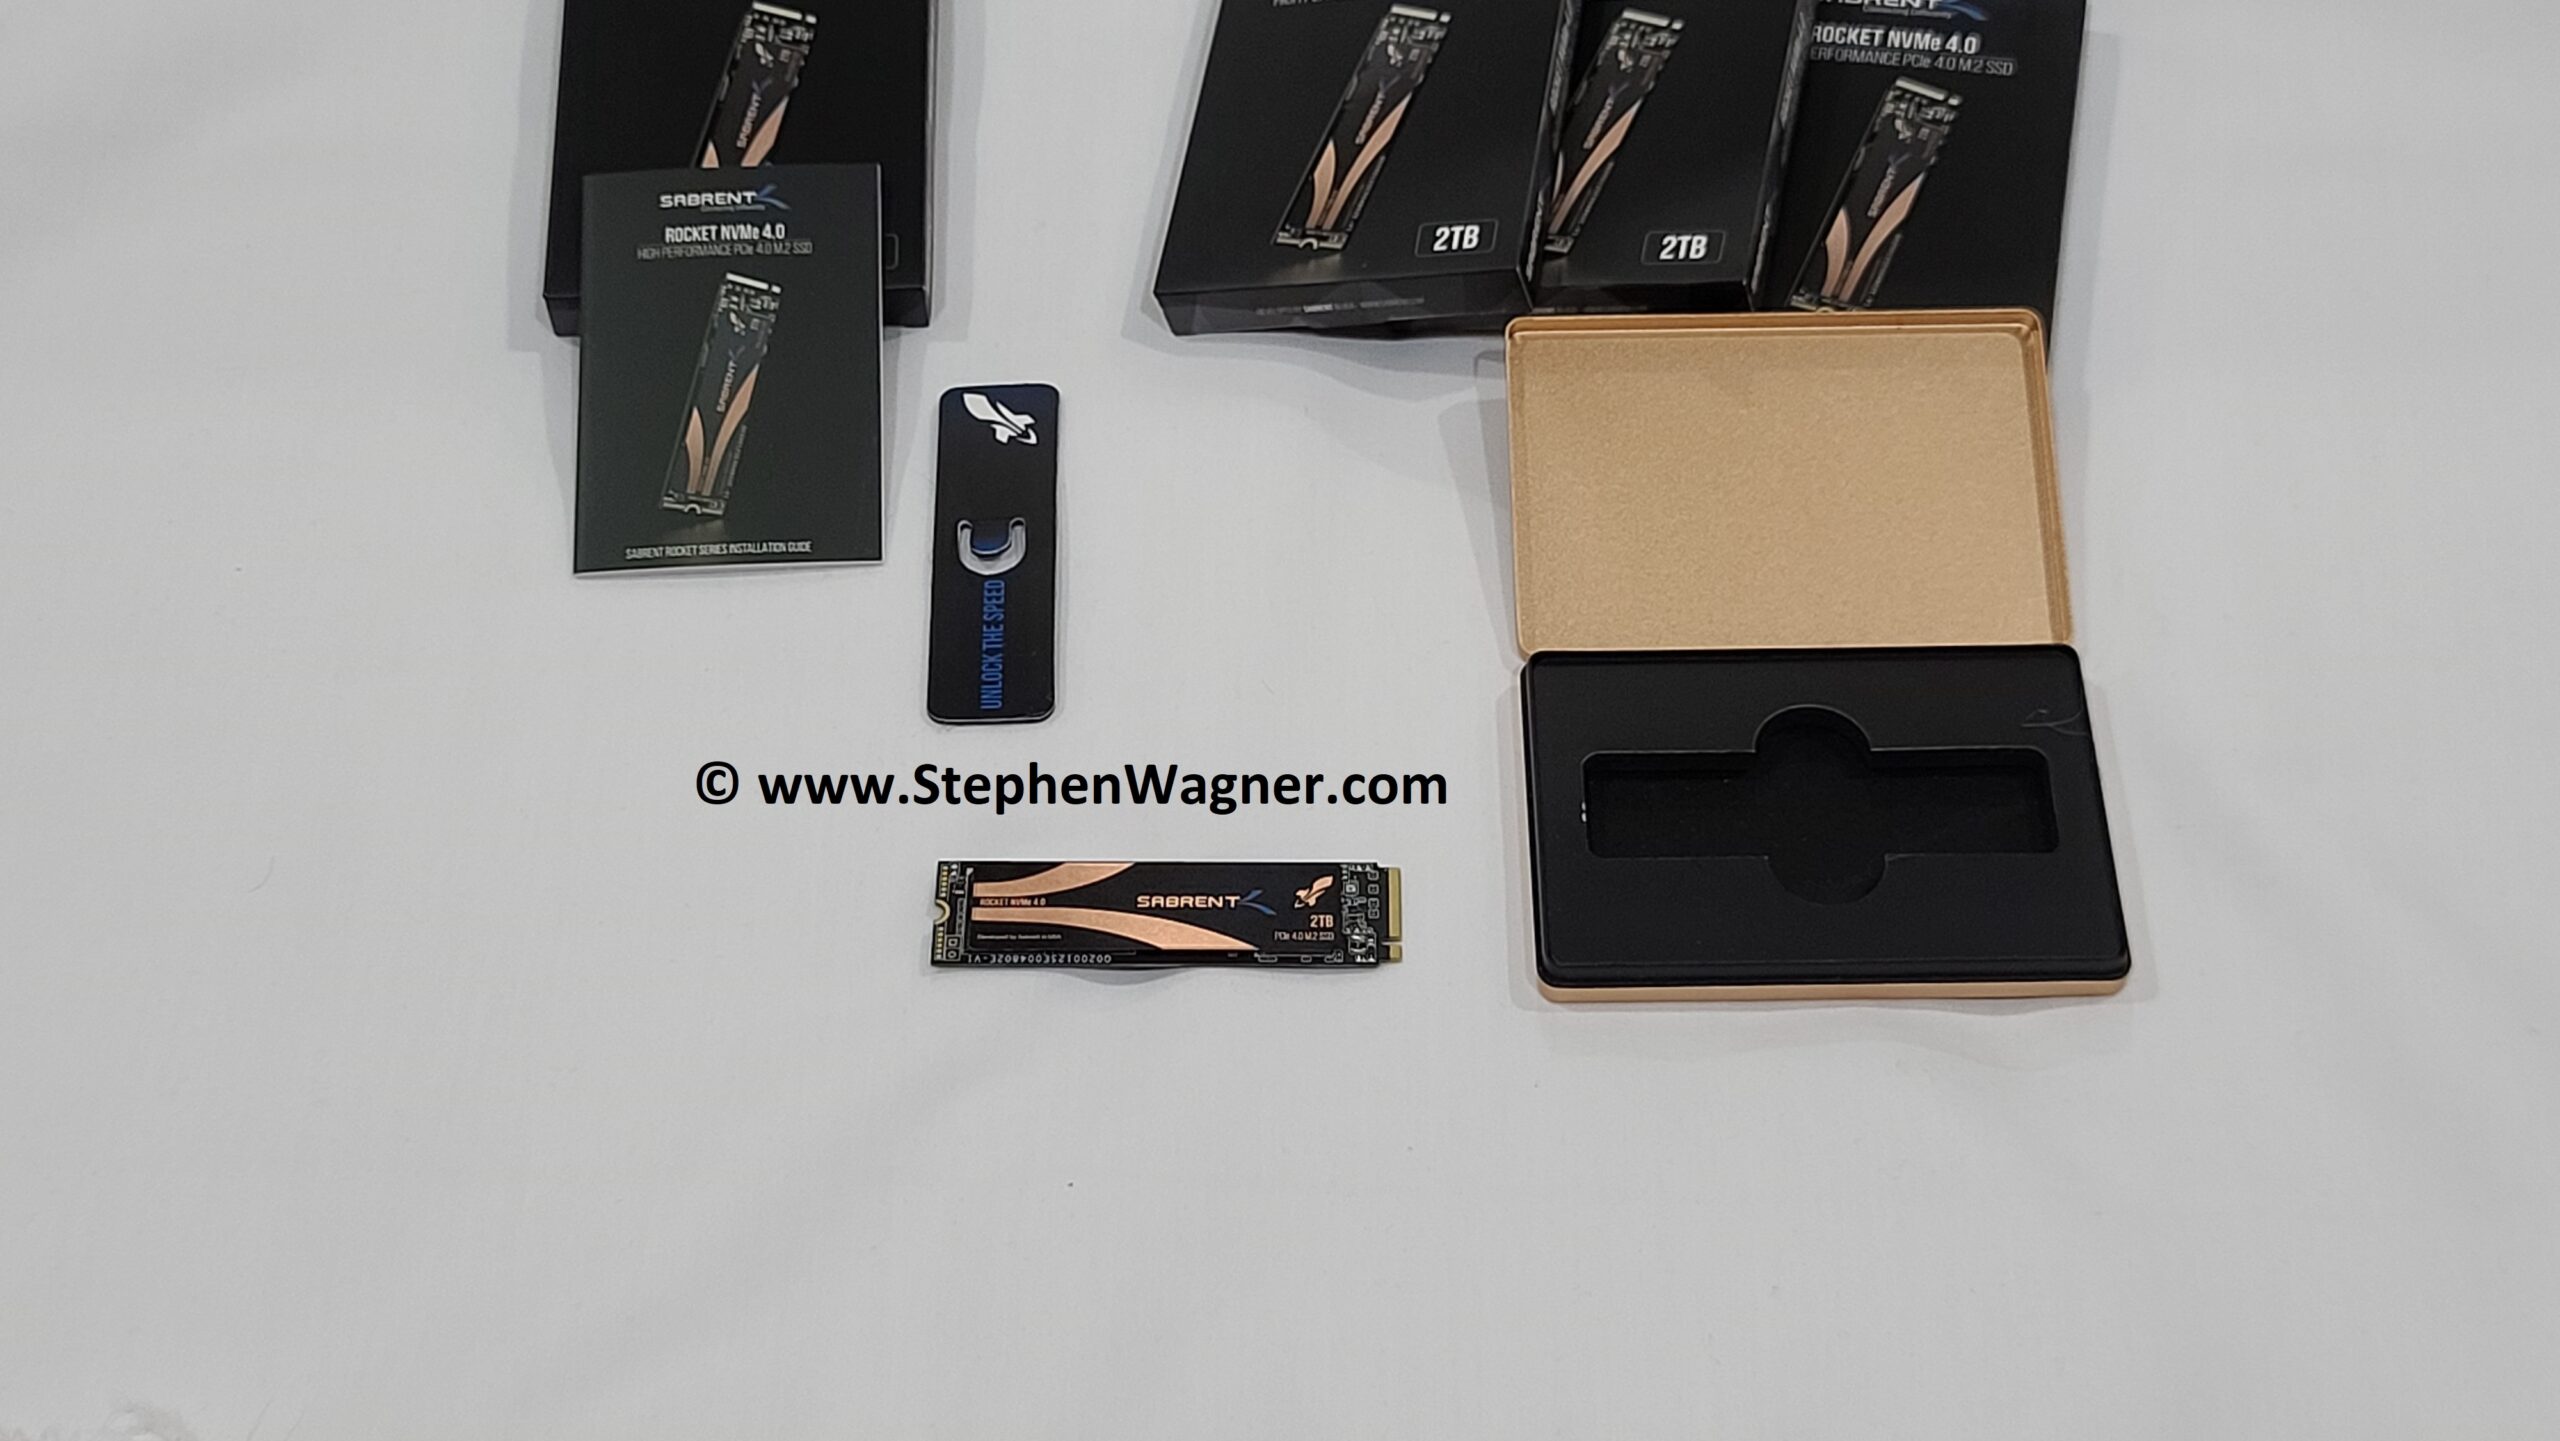
I start to install the Sabrent Rocket 4 NVMe 2TB SSD.
That’s a good looking 8TB of NVMe SSD!
Note that the cards will wiggle side to side and have play until screw is tightened. Do not over-tighten the screw!
Make sure before installing the heatsink cover that you remove the blue plastic film on the heat transfer material between NVME and heatsink, and the PEX chip and heatsink.
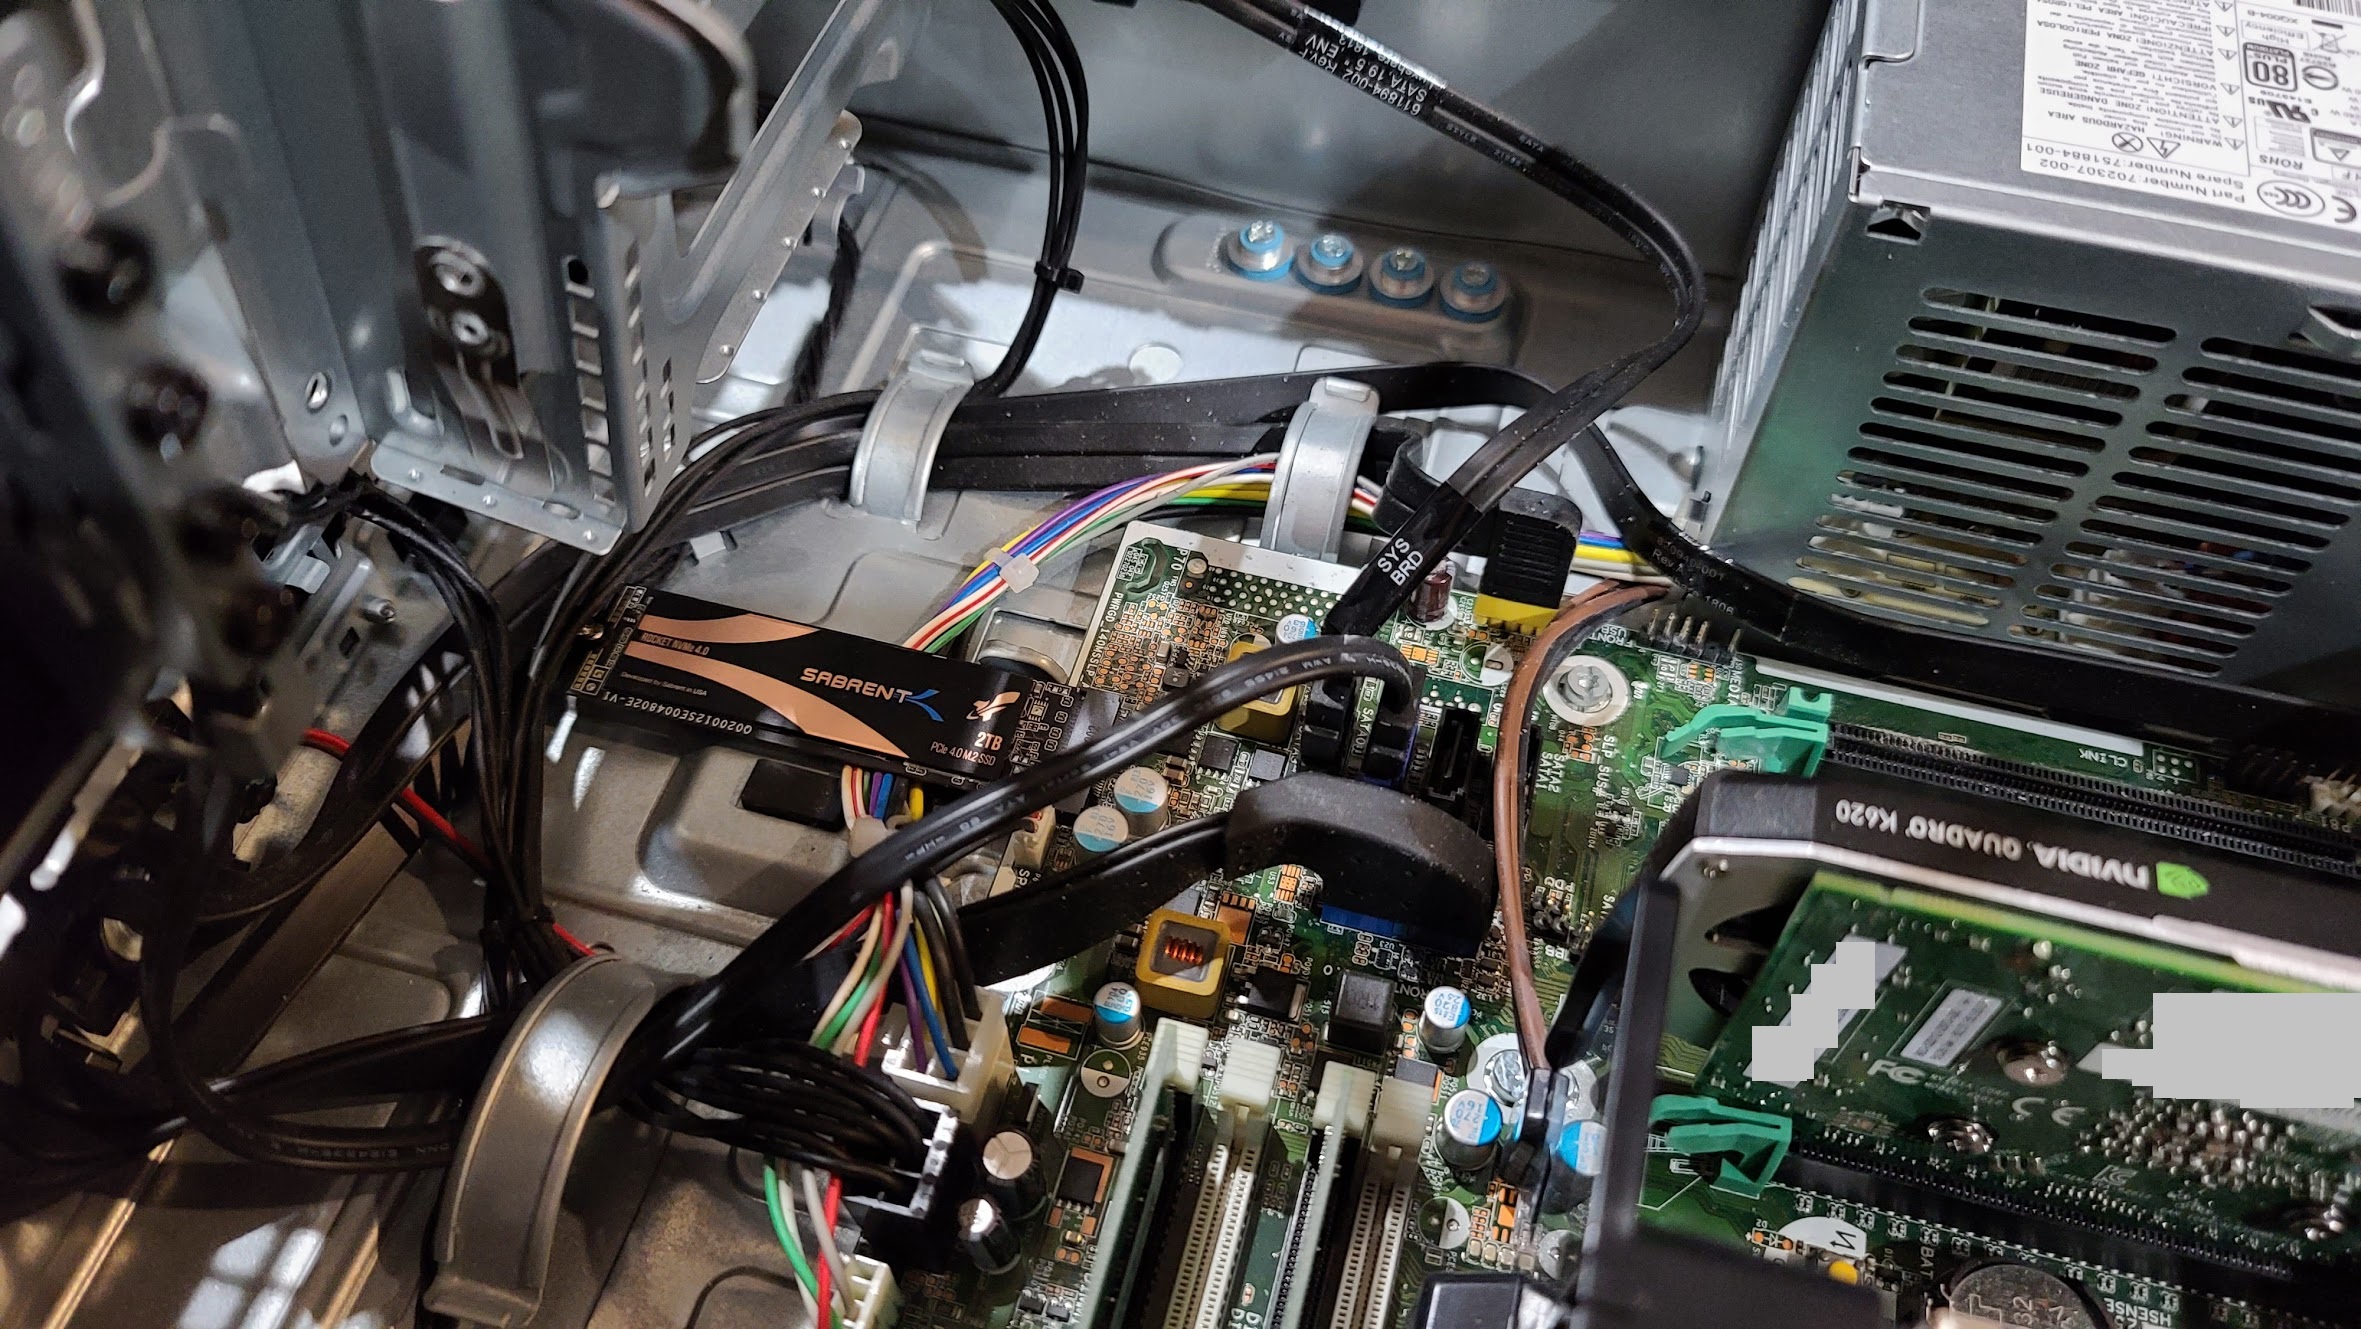
After that, I installed it in the server and was ready to go!
Heatsink and cooling
A quick note on the heatsink and cooling…
While the heatsink and cooling solution it comes with works amazing, you have flexibility if need be to run and operate the card without the heatsink and fan (the fan doesn’t cause any warnings if disconnected). This works out great if you want to use your own cooling solution, or need to use this card in a system where there isn’t much space. The fan can be removed by removing the screws and disconnecting the power connector.
Note, after installing the NVME SSD, and you affix the heatsink, in the future you will notice that the heatsink get’s stuck to the cards if you try to remove it at a later date. If you do need to remove the heatsink, be very patient and careful, and slowly remove the heatsink to avoid damaging or cracking the NVME SSD and the PCIe card itself.
Speedtest and benchmark
Let’s get to one of the best parts of this review, using the card!
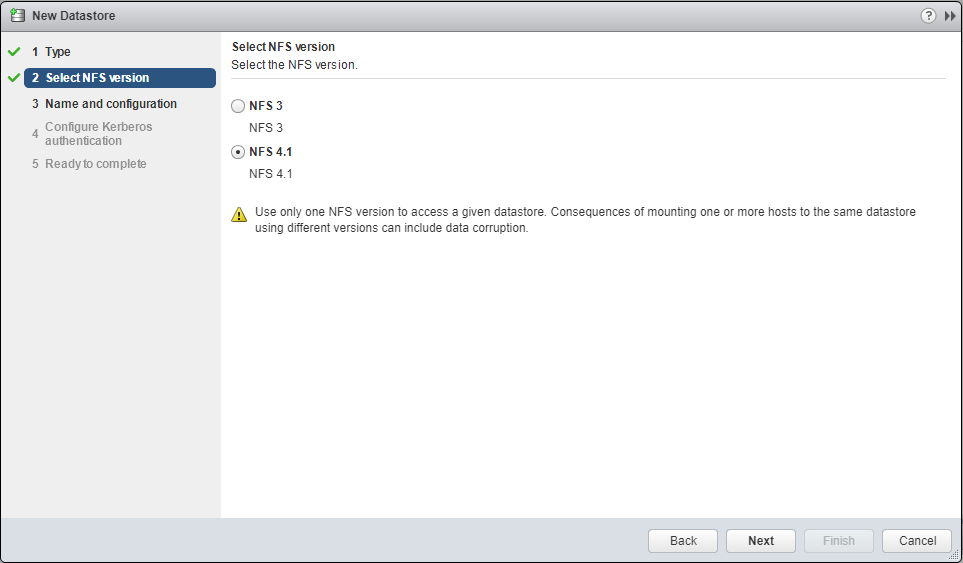
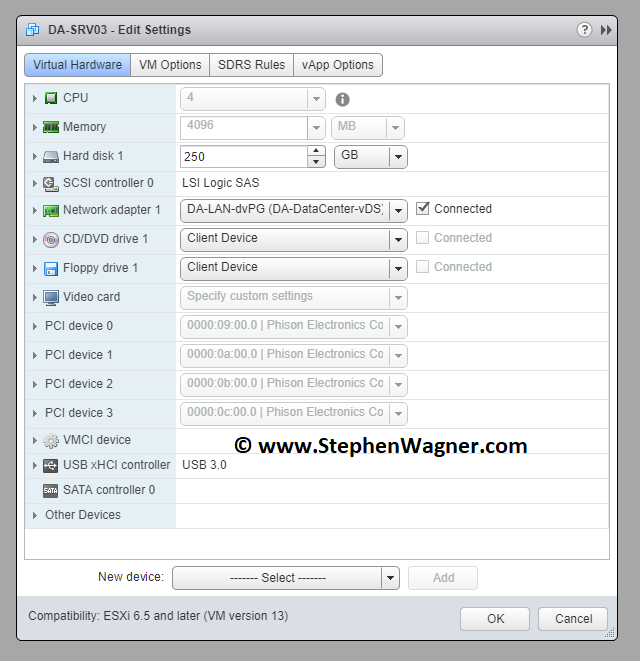
Unfortunately due to circumstances I won’t get in to, I only had access to a rack server to test the card. The server was running VMware vSphere and ESXi 6.5 U3.
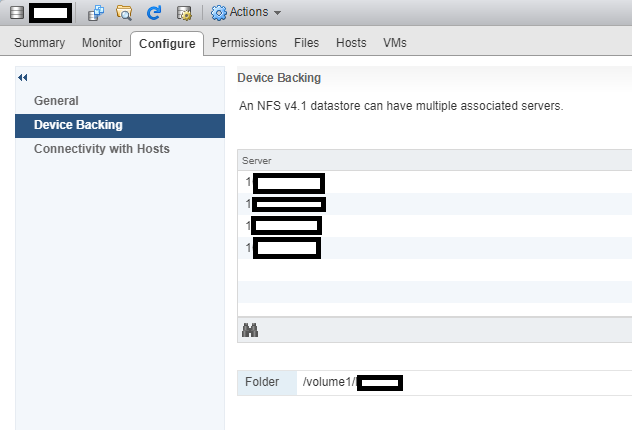
After shutting down the server, installing the card, and powering on, you could see the NVMe SSD appearing as available to PCI Passthrough to the VMs. I enabled passthrough and restarted again. I then added the individual 4 NVME drives as PCI passthrough devices to the VM.
Turning on the system, we are presented with the NVMe drives inside of the “Device Manager” on Windows Server 2016.
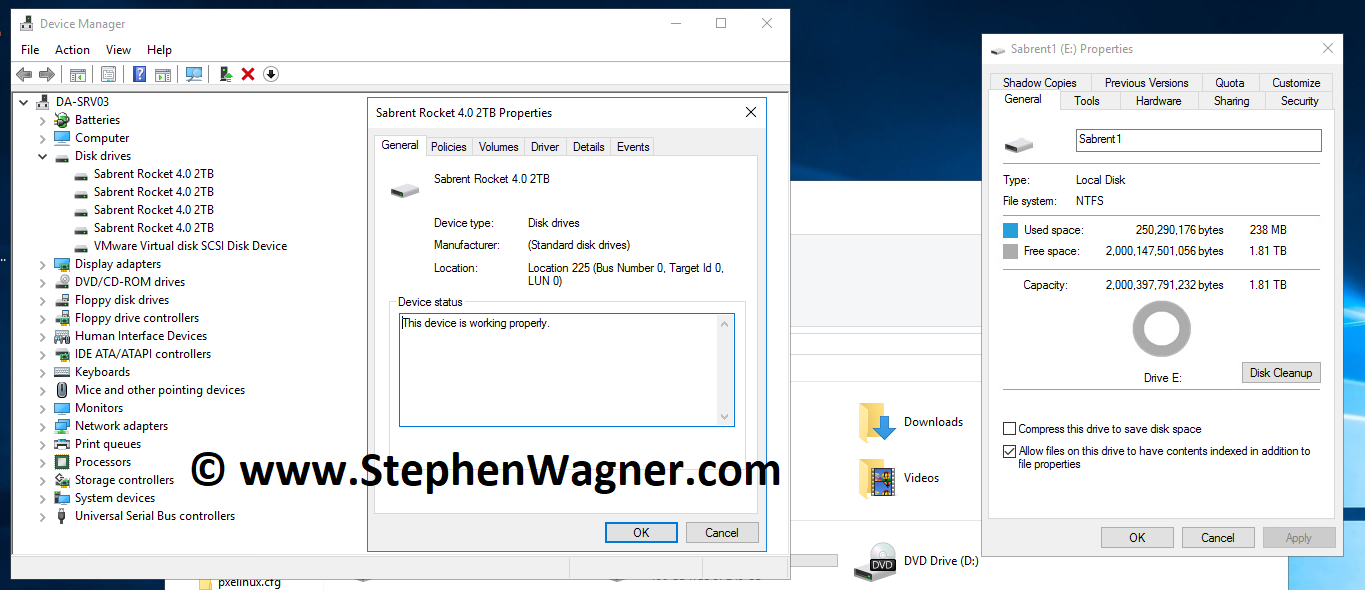
Now that was easy! Everything’s working perfectly…
Now we need to go in to disk manager and create some volumes for some quick speed tests and benchmarks.
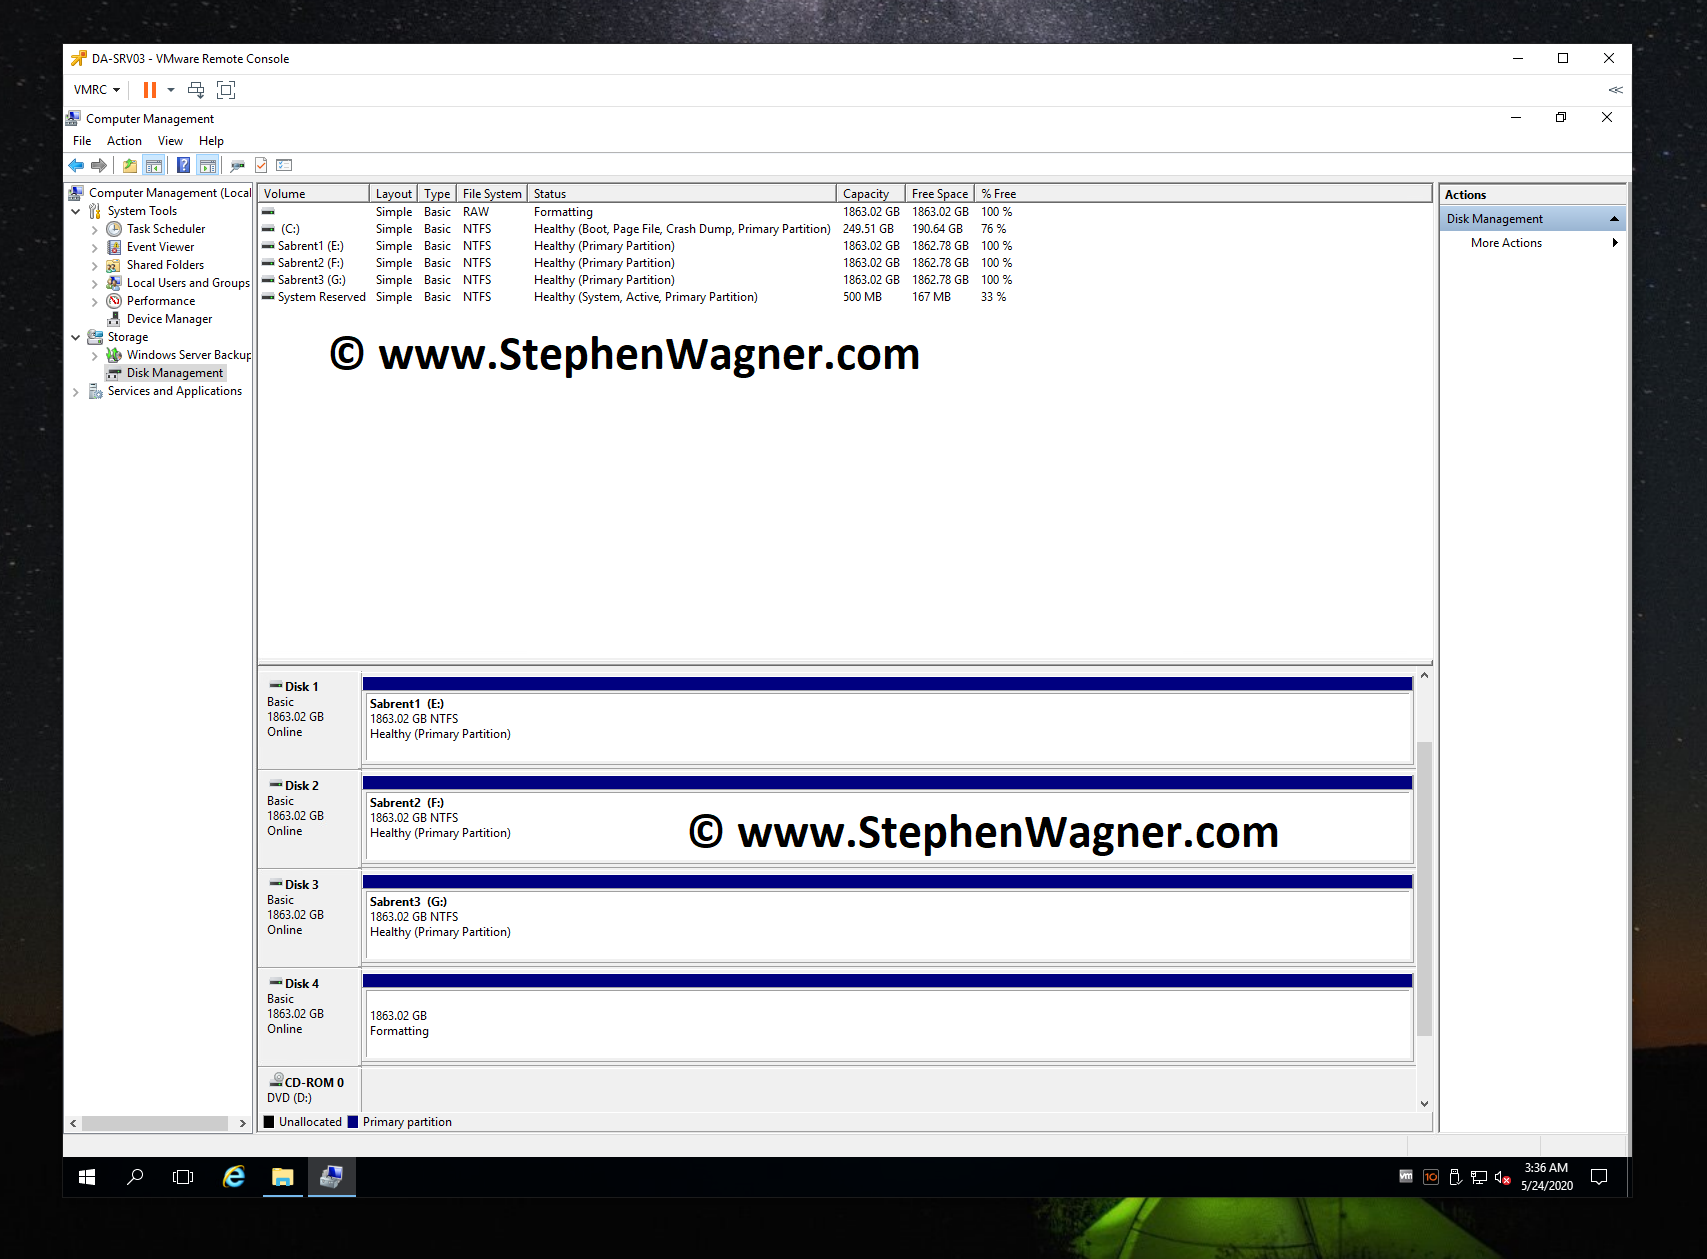
Again, no problems and very quick!
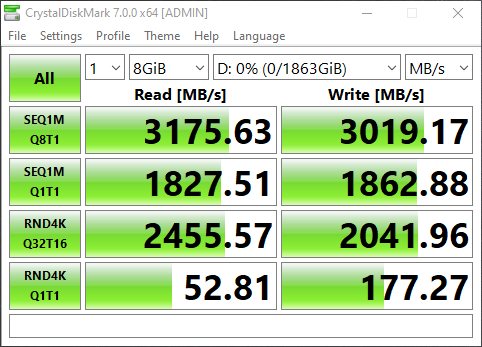
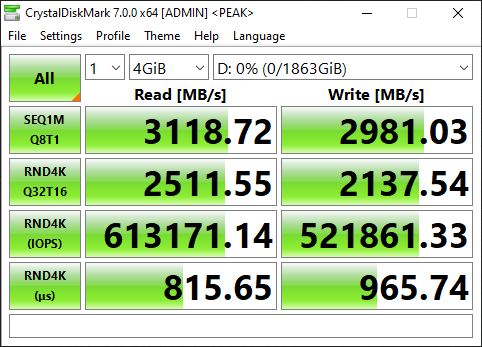
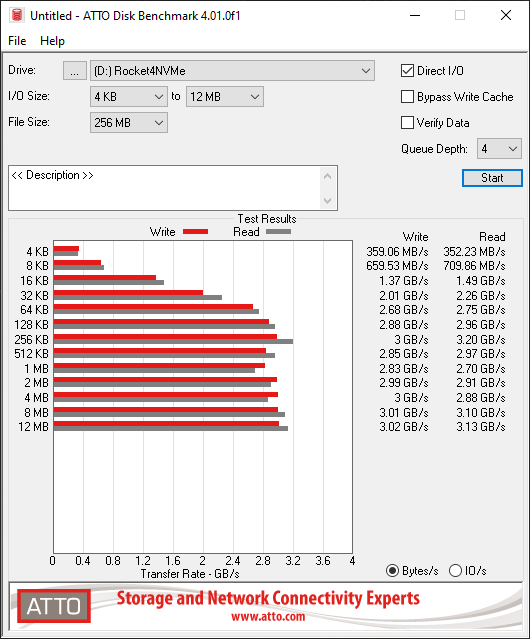
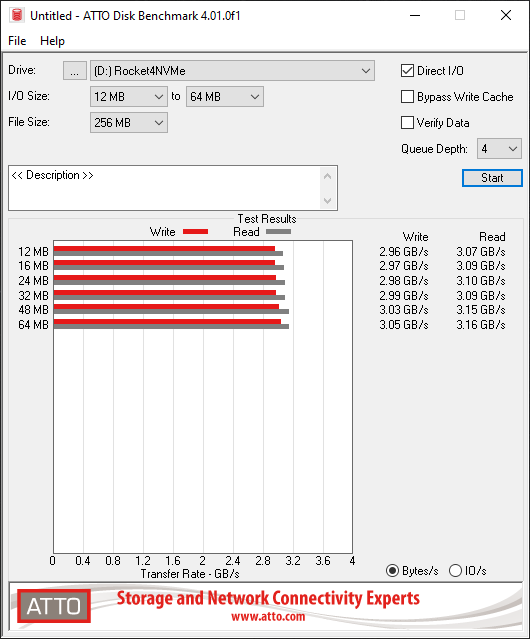
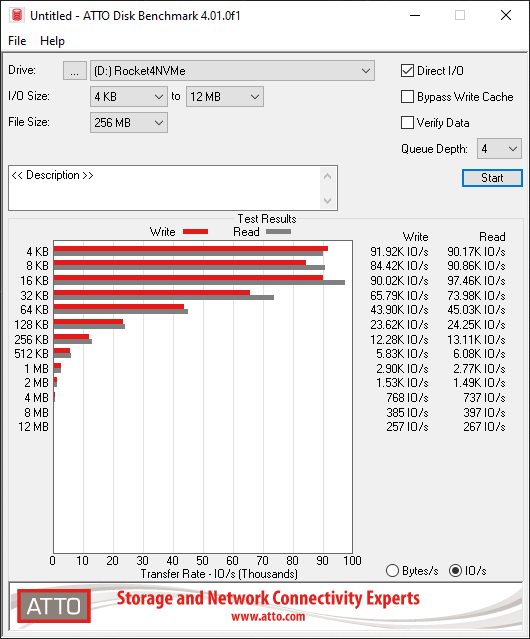
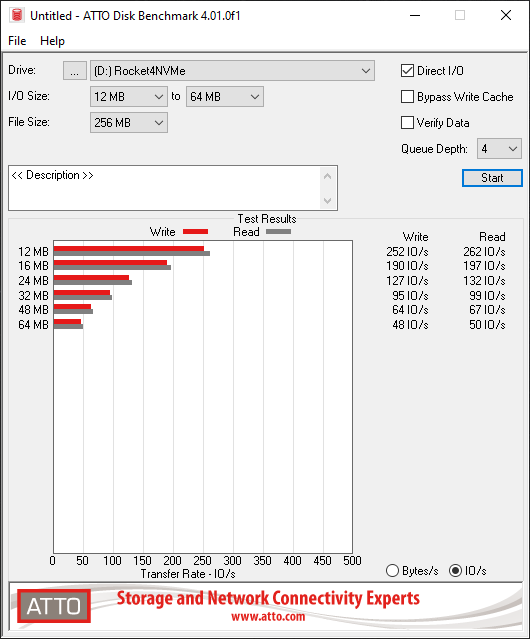
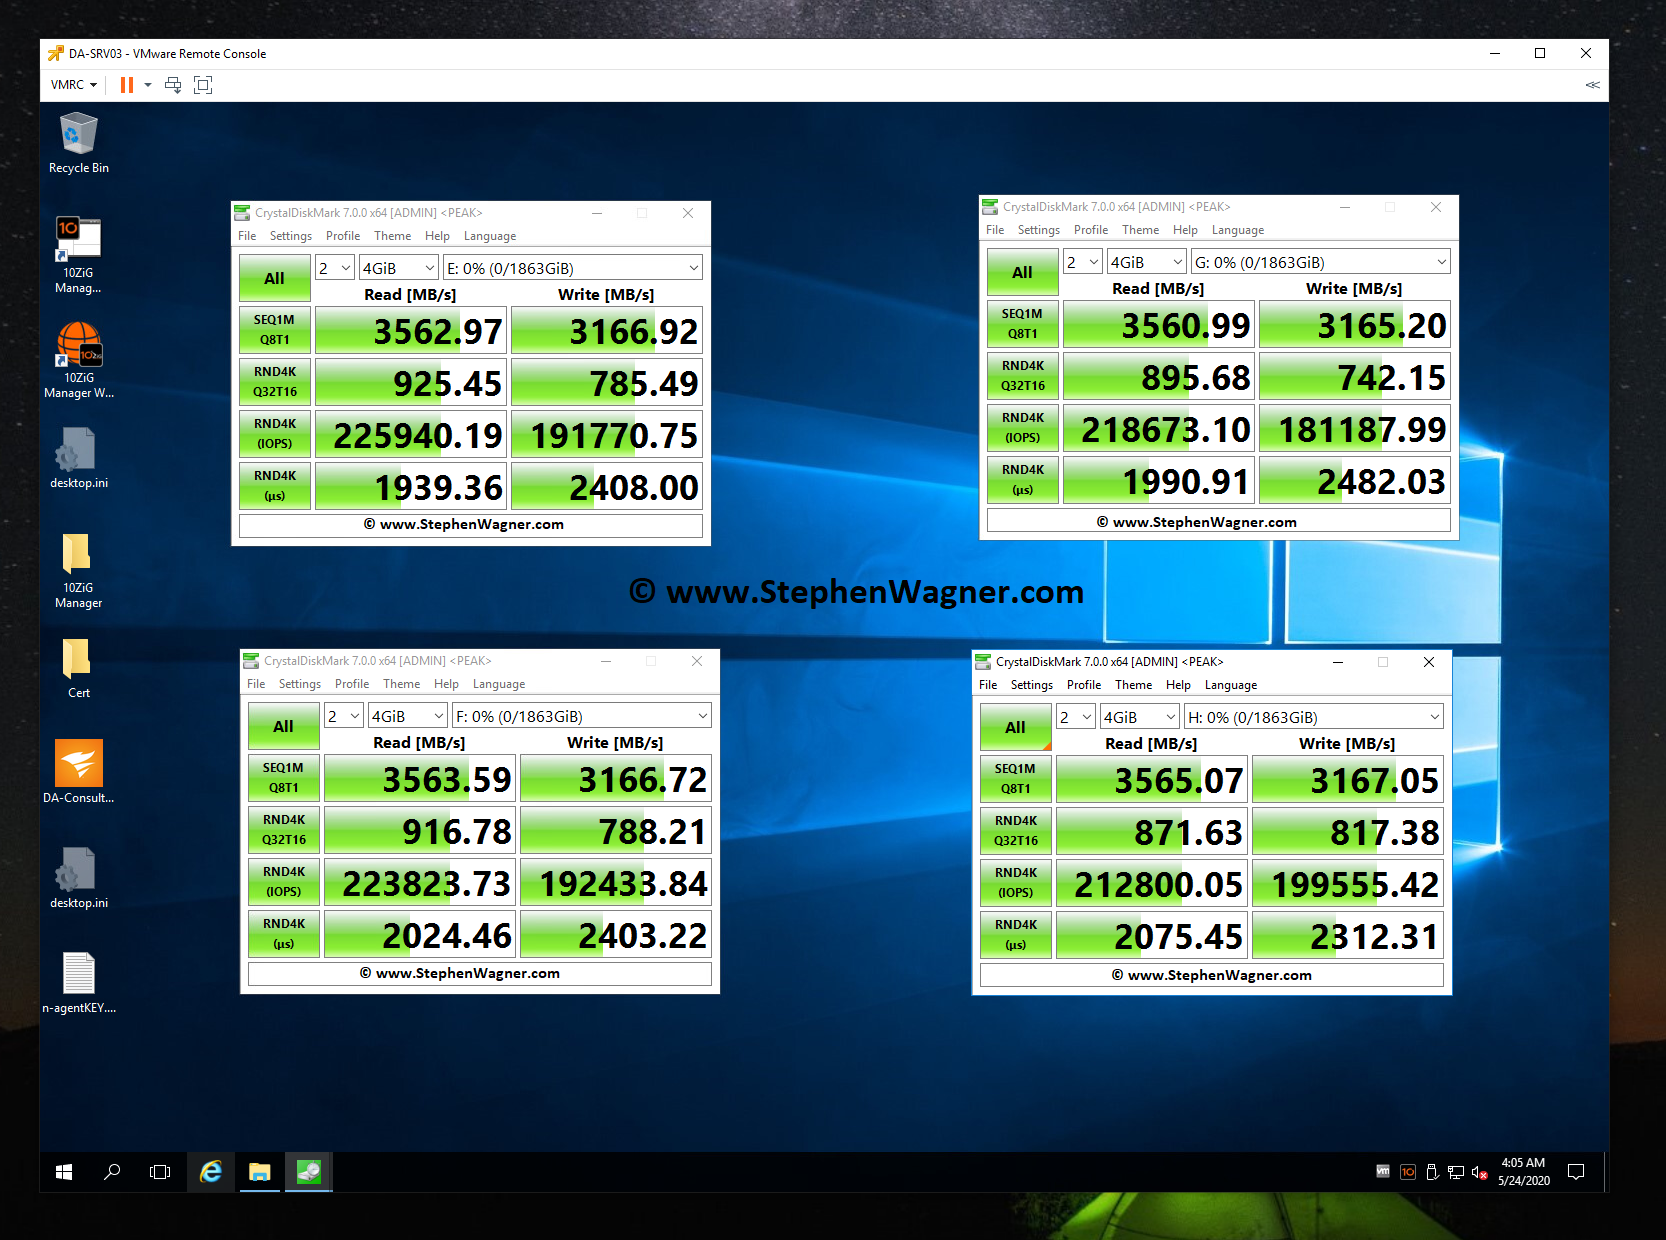
Let’s load up CrystalDiskMark and test the speed and IOPS!
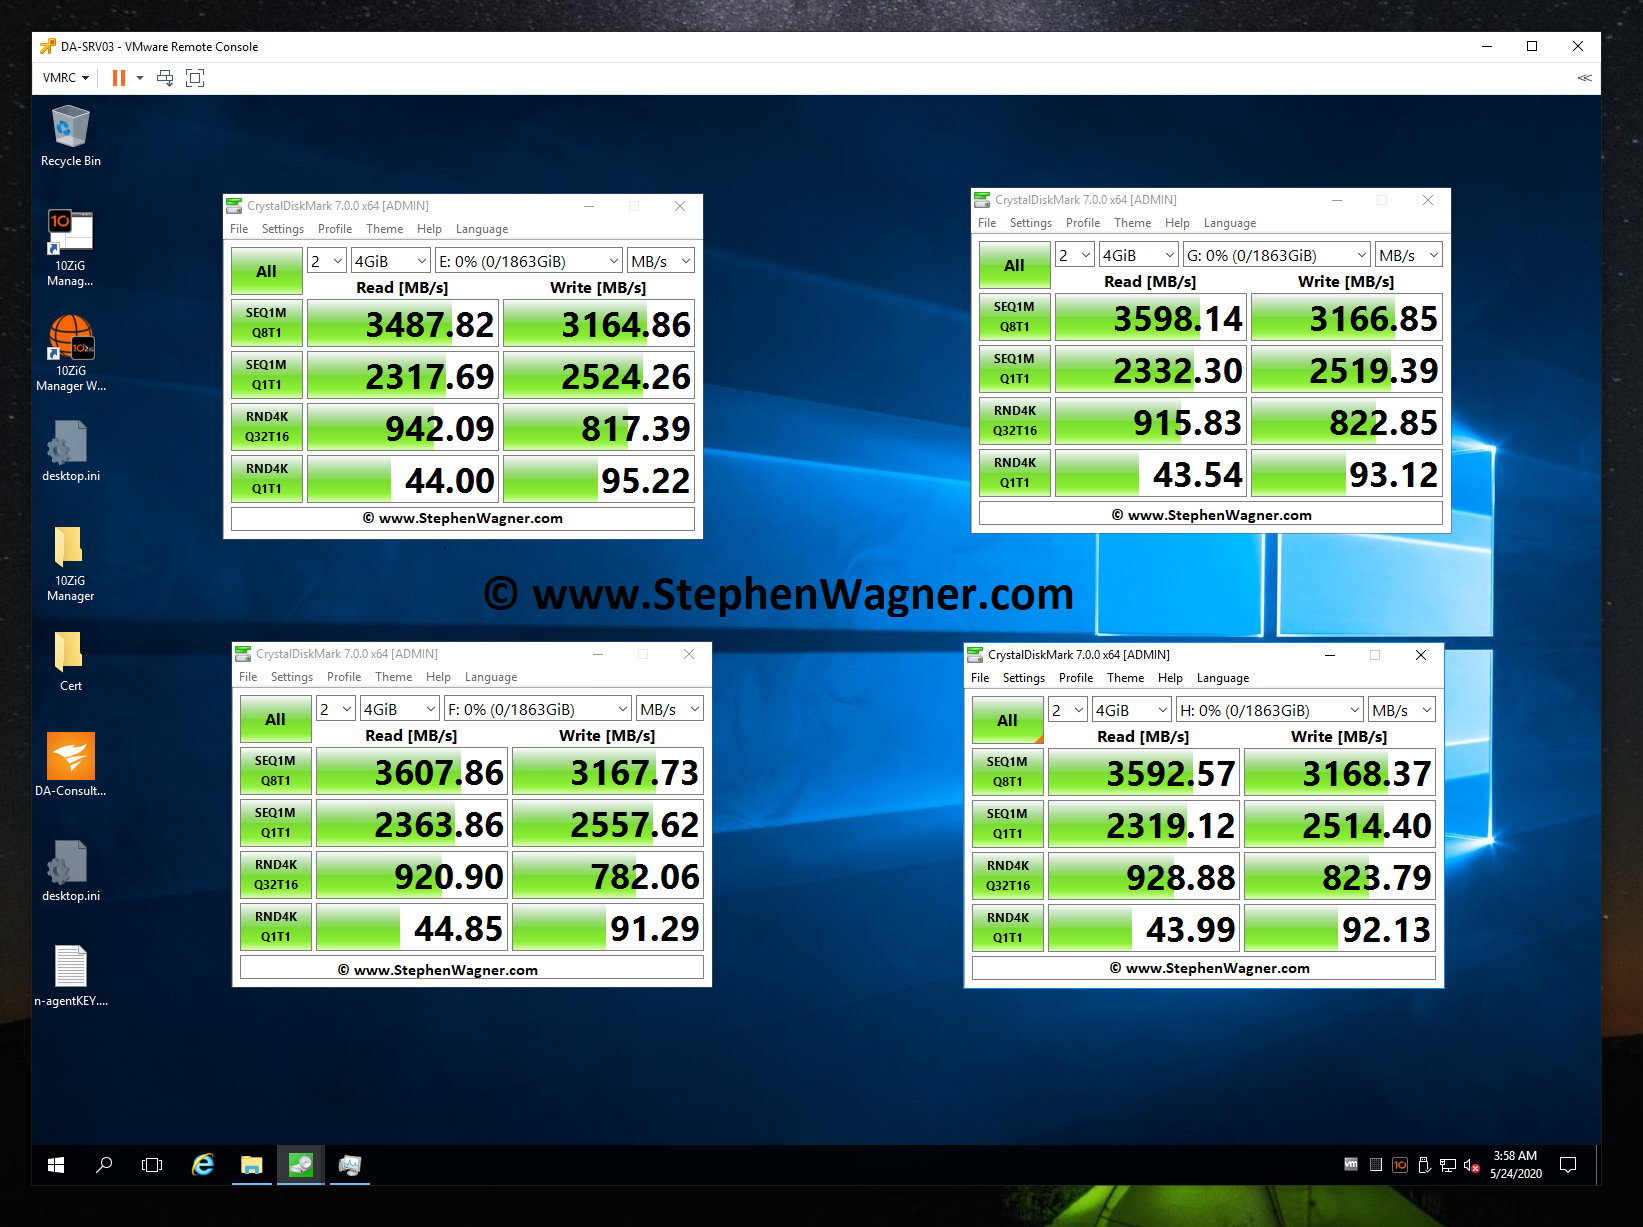
What’s interesting is that I was able to achieve much higher speeds using this card in an older system, than directly installing one of the SSDs in a new HP Z240 workstation. However, unfortunately due to CPU limitations (maxing the CPU out) of this server used above, I could not fully test, max out, or benchmark the IOPS on an individual SSD.
Additional Notes on the IO-PEX40152
Some additional notes I have on the IO-PEX40152:
The card works perfectly with VMware ESXi PCI passthrough when passing it through to a virtualized VM.
The card according to the specifications states a data transfer up to 1GB/sec, however I achieved over 3GB/sec using the Sabrent Rocket 4 NVME SSD.
While the specifications and features state it supports NVME spec 1.0 and 1.1, I don’t see why it wouldn’t support the newer specifications as it’s simply a PCIe switch which NVMe slots.
Conclusion
This is a fantastic card that you can use reliably if you have a system with a free x16 slot. Because of the fact it has a built in PCIe switch and doesn’t require PCIe bifurcation, you can confidently use it knowing it will work.
I’m looking forward to buying a couple more of these for some special applications and projects I have lined up, stay tuned for those!